| __timestamp | C.H. Robinson Worldwide, Inc. | Waste Connections, Inc. |
|---|---|---|
| Wednesday, January 1, 2014 | 805427000 | 717805000 |
| Thursday, January 1, 2015 | 924719000 | 191002871 |
| Friday, January 1, 2016 | 912200000 | 900371894 |
| Sunday, January 1, 2017 | 868096000 | 1380632000 |
| Monday, January 1, 2018 | 1008812000 | 1442229014 |
| Tuesday, January 1, 2019 | 890425000 | 1650754605 |
| Wednesday, January 1, 2020 | 774995000 | 1597555000 |
| Friday, January 1, 2021 | 1173367000 | 1891001000 |
| Saturday, January 1, 2022 | 1359558000 | 2090554149 |
| Sunday, January 1, 2023 | 613592000 | 2261354000 |
| Monday, January 1, 2024 | 766301000 | 2389779000 |
Unlocking the unknown
In the ever-evolving landscape of corporate finance, EBITDA serves as a crucial indicator of a company's operational efficiency. Over the past decade, Waste Connections, Inc. and C.H. Robinson Worldwide, Inc. have demonstrated contrasting trajectories in their EBITDA performance. From 2014 to 2023, Waste Connections has shown a remarkable growth of approximately 215%, peaking in 2023 with an EBITDA of over $2.26 billion. In contrast, C.H. Robinson's EBITDA has experienced fluctuations, with a notable decline of around 32% from its 2022 peak to 2023. This divergence highlights Waste Connections' robust expansion strategy, while C.H. Robinson faces challenges in maintaining its financial momentum. As we look to the future, stakeholders will be keenly observing how these industry giants adapt to market dynamics and leverage their financial strategies for sustained growth.
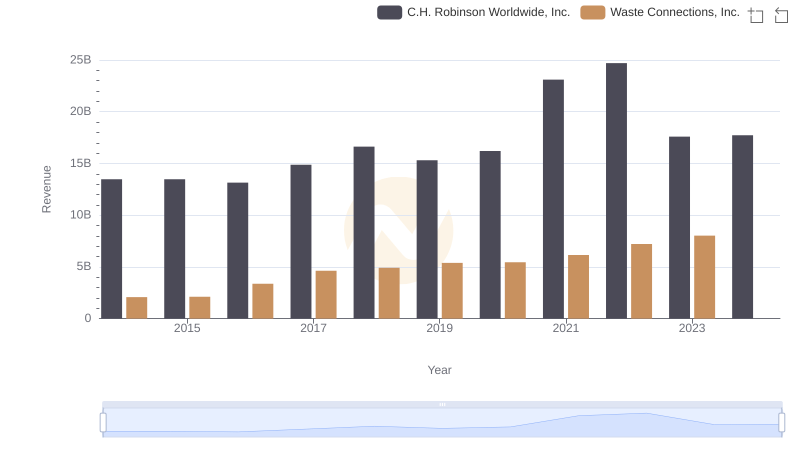
Revenue Insights: Waste Connections, Inc. and C.H. Robinson Worldwide, Inc. Performance Compared
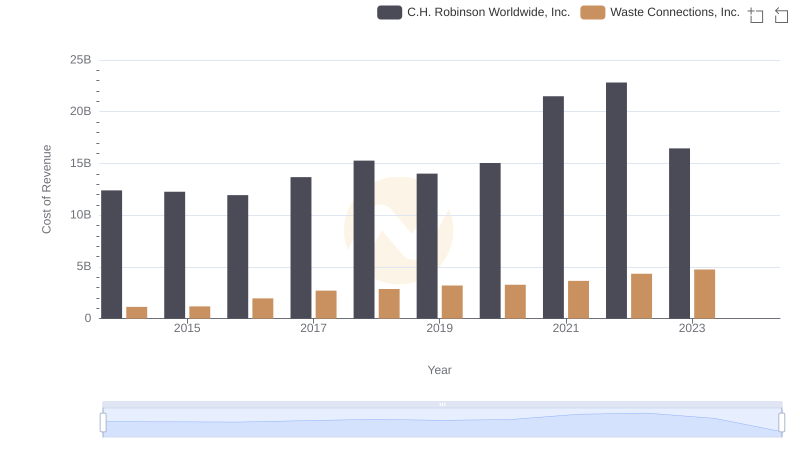
Analyzing Cost of Revenue: Waste Connections, Inc. and C.H. Robinson Worldwide, Inc.
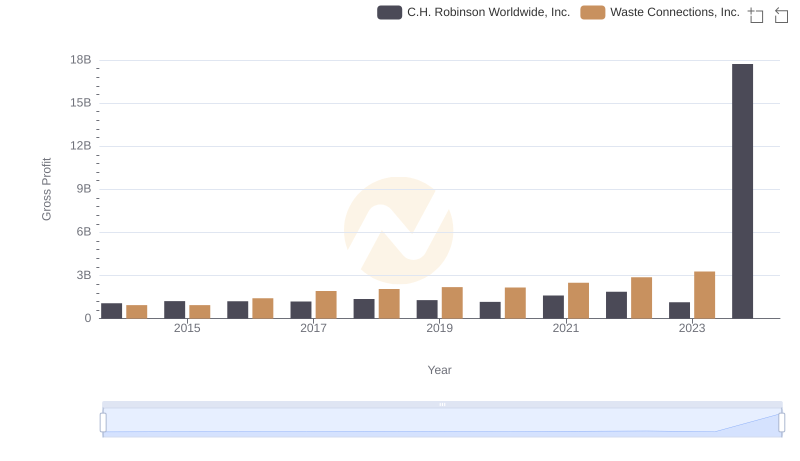
Key Insights on Gross Profit: Waste Connections, Inc. vs C.H. Robinson Worldwide, Inc.
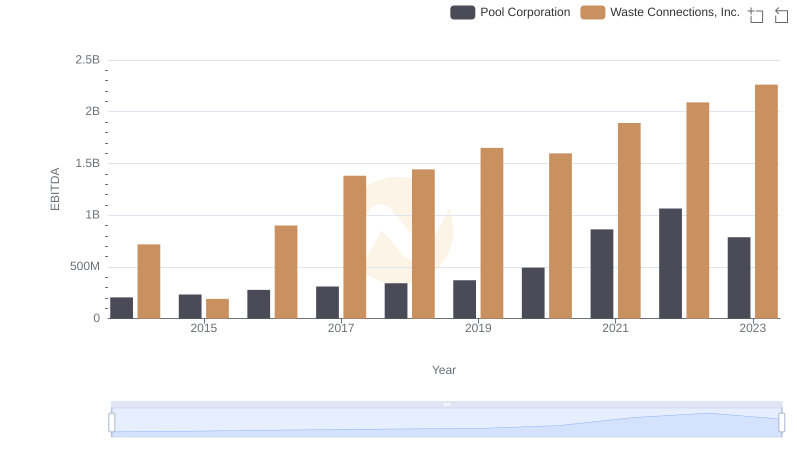
A Professional Review of EBITDA: Waste Connections, Inc. Compared to Pool Corporation
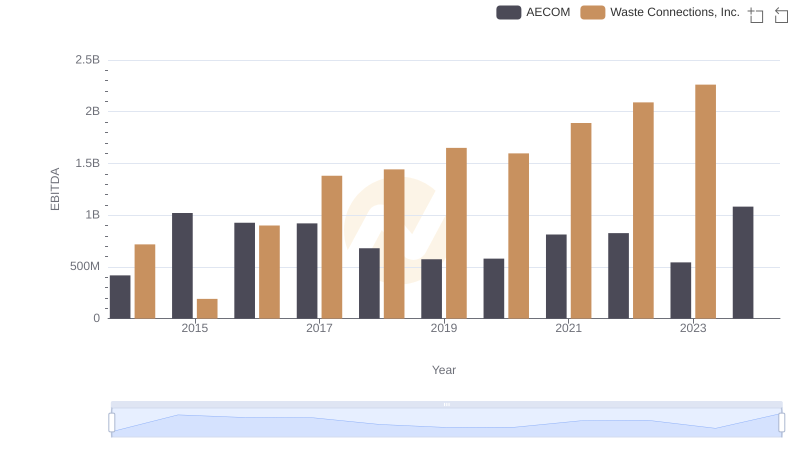
Professional EBITDA Benchmarking: Waste Connections, Inc. vs AECOM
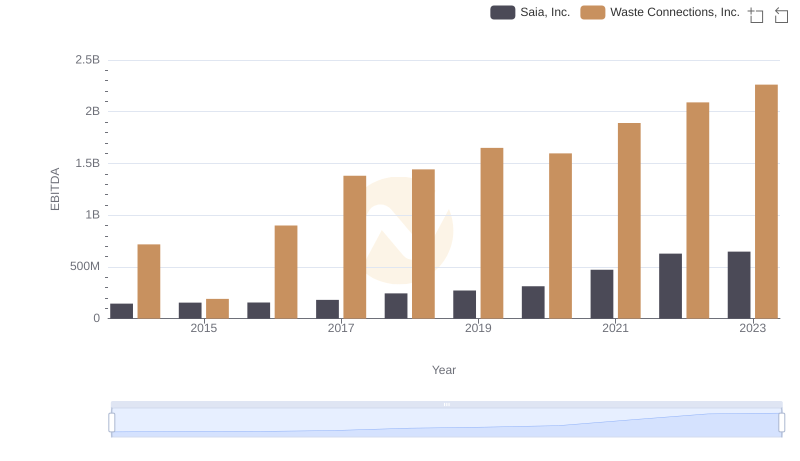
EBITDA Performance Review: Waste Connections, Inc. vs Saia, Inc.

Comprehensive EBITDA Comparison: Waste Connections, Inc. vs Nordson Corporation