| __timestamp | AECOM | Waste Connections, Inc. |
|---|---|---|
| Wednesday, January 1, 2014 | 80908000 | 229474000 |
| Thursday, January 1, 2015 | 113975000 | 237484000 |
| Friday, January 1, 2016 | 115088000 | 474263000 |
| Sunday, January 1, 2017 | 133309000 | 509638000 |
| Monday, January 1, 2018 | 135787000 | 524388000 |
| Tuesday, January 1, 2019 | 148123000 | 546278000 |
| Wednesday, January 1, 2020 | 188535000 | 537632000 |
| Friday, January 1, 2021 | 155072000 | 612337000 |
| Saturday, January 1, 2022 | 147309000 | 696467000 |
| Sunday, January 1, 2023 | 153575000 | 799119000 |
| Monday, January 1, 2024 | 160105000 | 883445000 |
Unleashing the power of data
In the ever-evolving landscape of corporate finance, Selling, General, and Administrative (SG&A) expenses serve as a critical indicator of a company's operational efficiency. Waste Connections, Inc. and AECOM, two industry giants, have shown contrasting trends in their SG&A expenses from 2014 to 2023.
Waste Connections, Inc. has experienced a remarkable 248% increase in SG&A expenses over the past decade, peaking at nearly $800 million in 2023. This upward trajectory reflects the company's aggressive expansion and strategic investments.
In contrast, AECOM's SG&A expenses have grown by approximately 98% during the same period, reaching around $160 million in 2023. This steady growth suggests a more conservative approach to scaling operations.
The data for 2024 remains incomplete, leaving room for speculation on future trends.

Waste Connections, Inc. and AECOM: A Detailed Gross Profit Analysis
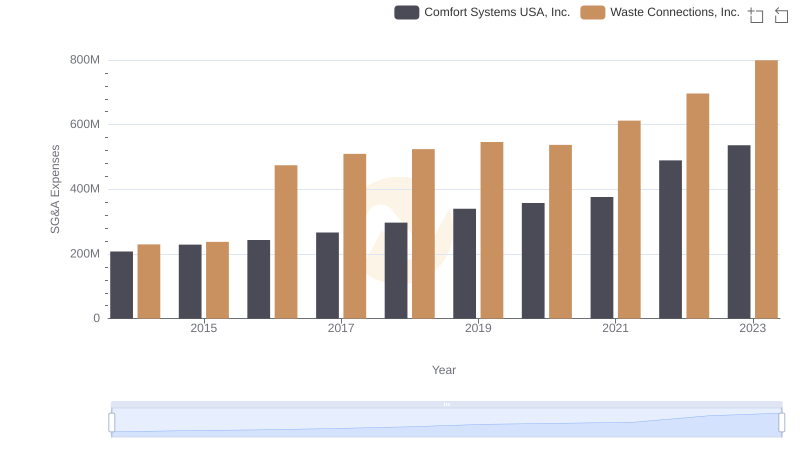
Operational Costs Compared: SG&A Analysis of Waste Connections, Inc. and Comfort Systems USA, Inc.
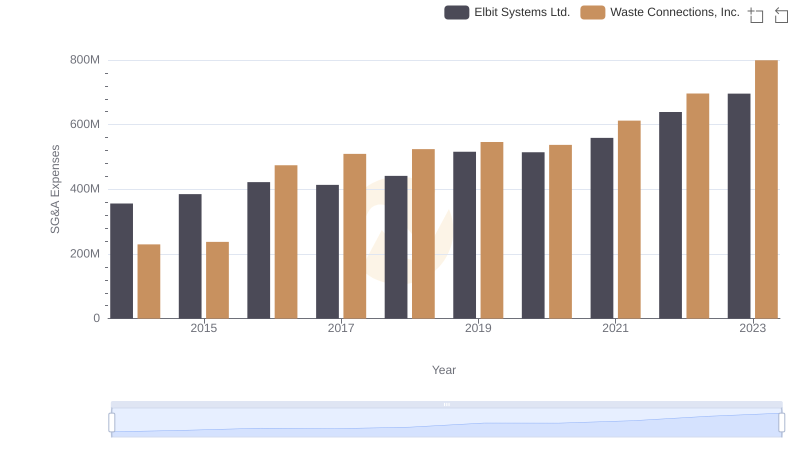
Waste Connections, Inc. and Elbit Systems Ltd.: SG&A Spending Patterns Compared
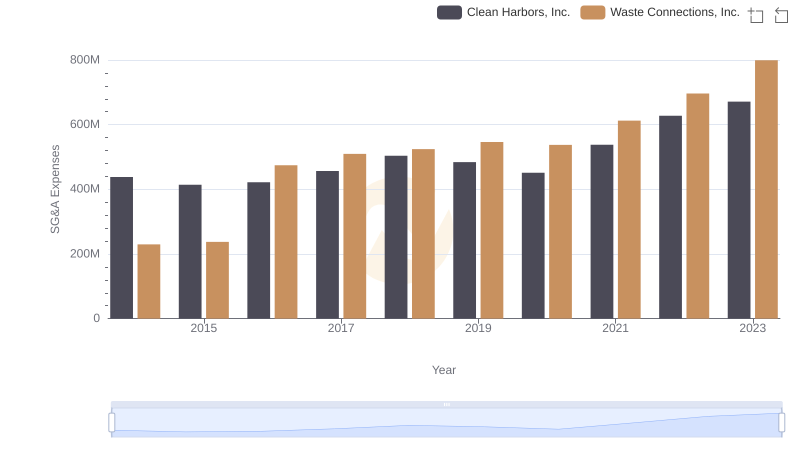
Selling, General, and Administrative Costs: Waste Connections, Inc. vs Clean Harbors, Inc.
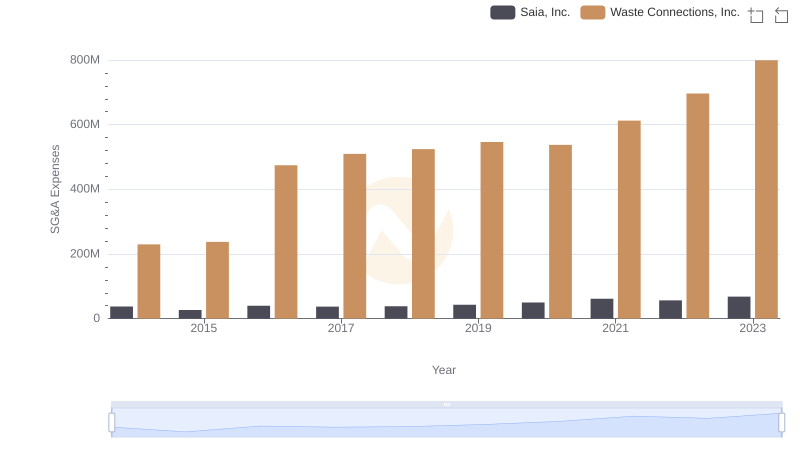
SG&A Efficiency Analysis: Comparing Waste Connections, Inc. and Saia, Inc.
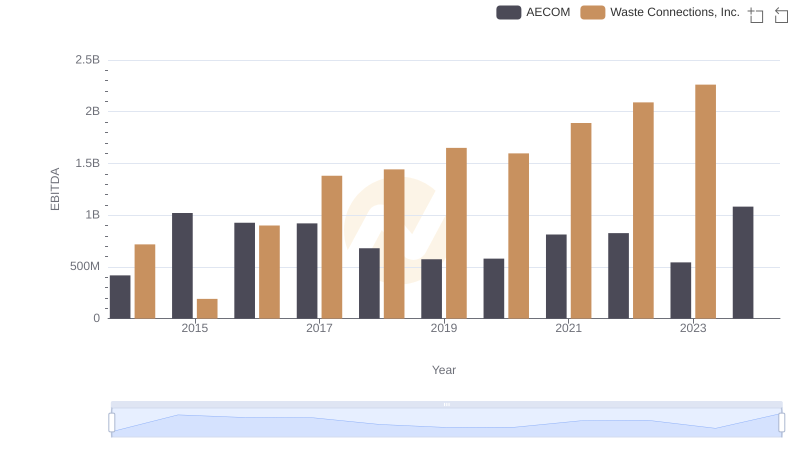
Professional EBITDA Benchmarking: Waste Connections, Inc. vs AECOM