| __timestamp | Expeditors International of Washington, Inc. | Waste Connections, Inc. |
|---|---|---|
| Wednesday, January 1, 2014 | 38125000 | 229474000 |
| Thursday, January 1, 2015 | 41990000 | 237484000 |
| Friday, January 1, 2016 | 41763000 | 474263000 |
| Sunday, January 1, 2017 | 44290000 | 509638000 |
| Monday, January 1, 2018 | 45346000 | 524388000 |
| Tuesday, January 1, 2019 | 44002000 | 546278000 |
| Wednesday, January 1, 2020 | 18436000 | 537632000 |
| Friday, January 1, 2021 | 16026000 | 612337000 |
| Saturday, January 1, 2022 | 24293000 | 696467000 |
| Sunday, January 1, 2023 | 27913000 | 799119000 |
| Monday, January 1, 2024 | 33331000 | 883445000 |
Igniting the spark of knowledge
In the ever-evolving landscape of corporate finance, understanding the nuances of Selling, General, and Administrative (SG&A) expenses is crucial. Over the past decade, Waste Connections, Inc. and Expeditors International of Washington, Inc. have showcased contrasting trends in their SG&A expenditures. From 2014 to 2023, Waste Connections, Inc. has seen a remarkable increase of approximately 248% in their SG&A expenses, reflecting their aggressive expansion and operational scaling. In contrast, Expeditors International of Washington, Inc. experienced a decline of about 27% in the same period, indicating a strategic shift towards cost efficiency and streamlined operations. This divergence highlights the distinct strategic priorities of these industry giants. As businesses navigate the complexities of the modern economy, such insights into SG&A trends offer valuable lessons in balancing growth with fiscal prudence.
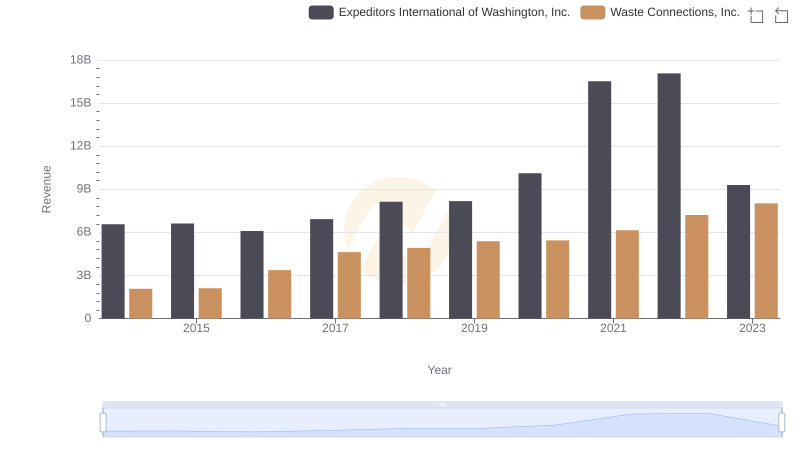
Waste Connections, Inc. or Expeditors International of Washington, Inc.: Who Leads in Yearly Revenue?

Analyzing Cost of Revenue: Waste Connections, Inc. and Expeditors International of Washington, Inc.
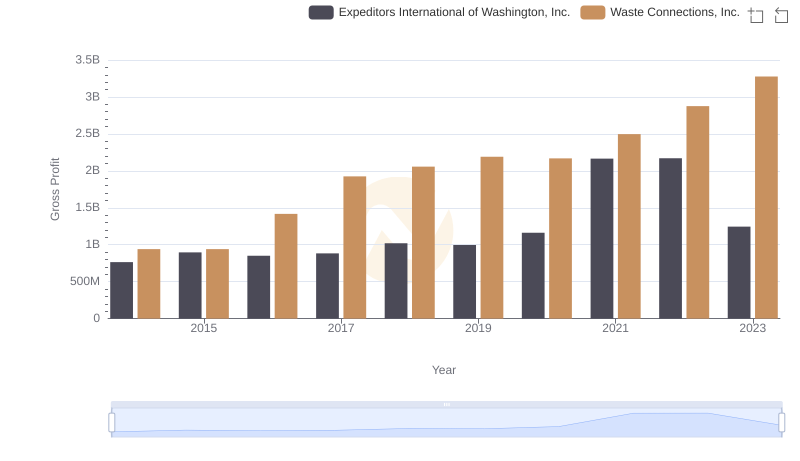
Gross Profit Trends Compared: Waste Connections, Inc. vs Expeditors International of Washington, Inc.

Waste Connections, Inc. and IDEX Corporation: SG&A Spending Patterns Compared
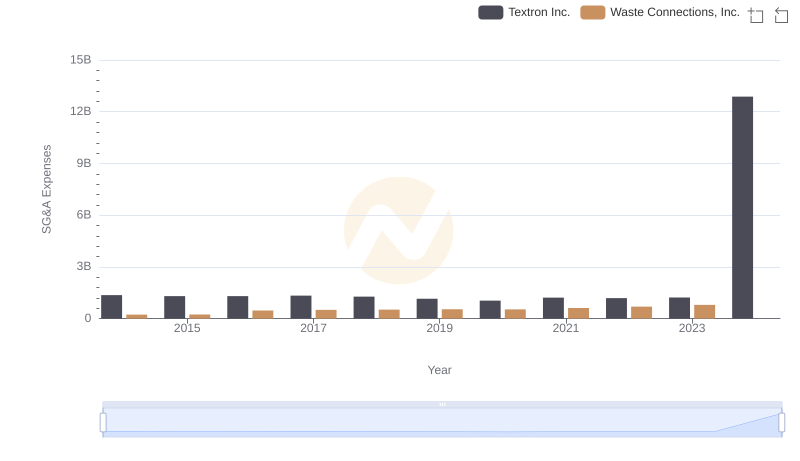
Breaking Down SG&A Expenses: Waste Connections, Inc. vs Textron Inc.
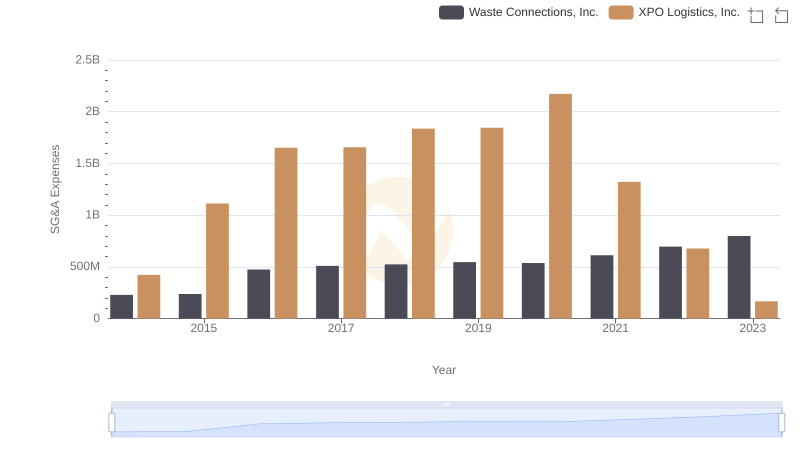
Breaking Down SG&A Expenses: Waste Connections, Inc. vs XPO Logistics, Inc.
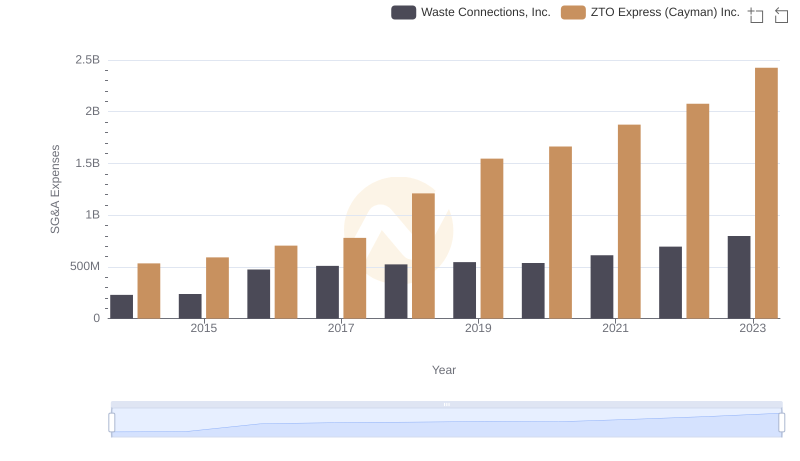
Waste Connections, Inc. vs ZTO Express (Cayman) Inc.: SG&A Expense Trends
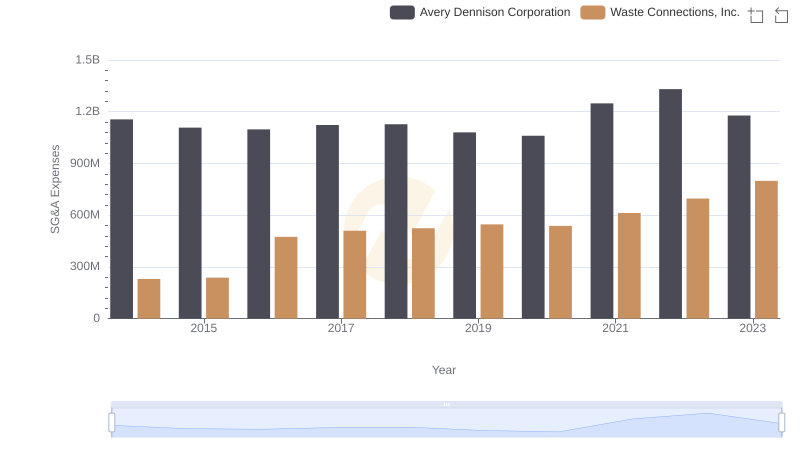
Breaking Down SG&A Expenses: Waste Connections, Inc. vs Avery Dennison Corporation
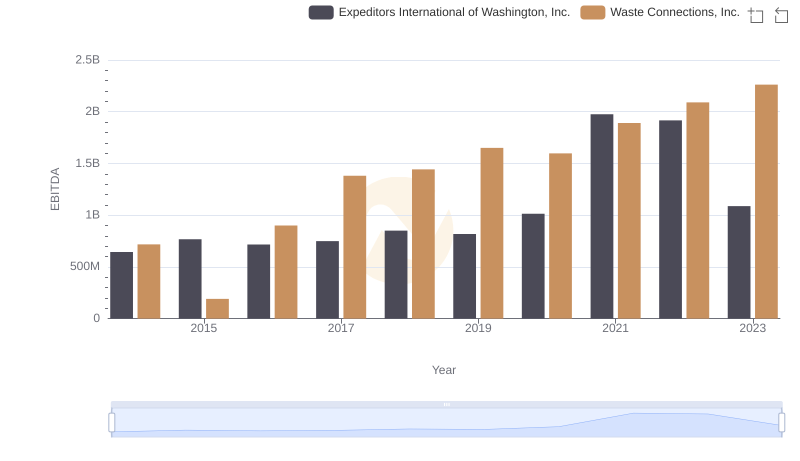
A Side-by-Side Analysis of EBITDA: Waste Connections, Inc. and Expeditors International of Washington, Inc.
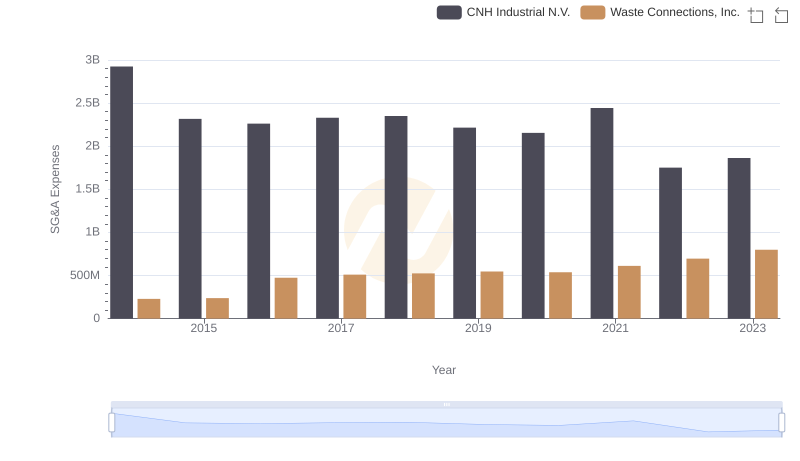
Waste Connections, Inc. vs CNH Industrial N.V.: SG&A Expense Trends
Operational Costs Compared: SG&A Analysis of Waste Connections, Inc. and Graco Inc.