| __timestamp | Quanta Services, Inc. | United Rentals, Inc. |
|---|---|---|
| Wednesday, January 1, 2014 | 1233520000 | 2432000000 |
| Thursday, January 1, 2015 | 923665000 | 2480000000 |
| Friday, January 1, 2016 | 1013800000 | 2403000000 |
| Sunday, January 1, 2017 | 1241860000 | 2769000000 |
| Monday, January 1, 2018 | 1479964000 | 3364000000 |
| Tuesday, January 1, 2019 | 1600252000 | 3670000000 |
| Wednesday, January 1, 2020 | 1660847000 | 3183000000 |
| Friday, January 1, 2021 | 1953259000 | 3853000000 |
| Saturday, January 1, 2022 | 2529155000 | 4996000000 |
| Sunday, January 1, 2023 | 2937086000 | 5813000000 |
| Monday, January 1, 2024 | 6150000000 |
Unlocking the unknown
In the ever-evolving landscape of industrial services, United Rentals, Inc. and Quanta Services, Inc. have emerged as formidable players. Over the past decade, United Rentals has consistently outperformed Quanta Services in terms of gross profit, showcasing a robust growth trajectory. From 2014 to 2023, United Rentals' gross profit surged by approximately 139%, peaking at an impressive $5.8 billion in 2023. In contrast, Quanta Services experienced a more modest growth of around 138%, reaching $2.9 billion in the same year.
The data reveals a compelling narrative of strategic expansion and market adaptation. While United Rentals capitalized on its extensive equipment rental network, Quanta Services leveraged its expertise in infrastructure solutions. However, the absence of data for Quanta Services in 2024 leaves room for speculation about its future performance. As these industry giants continue to evolve, their financial trajectories offer valuable insights into the dynamics of the industrial sector.
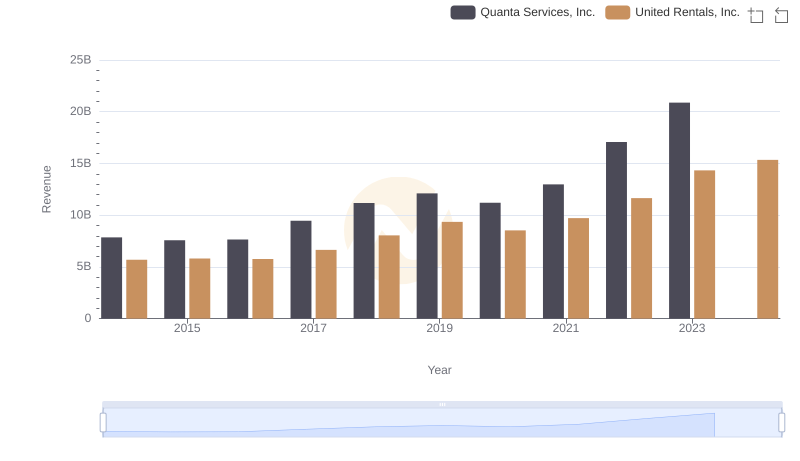
United Rentals, Inc. or Quanta Services, Inc.: Who Leads in Yearly Revenue?
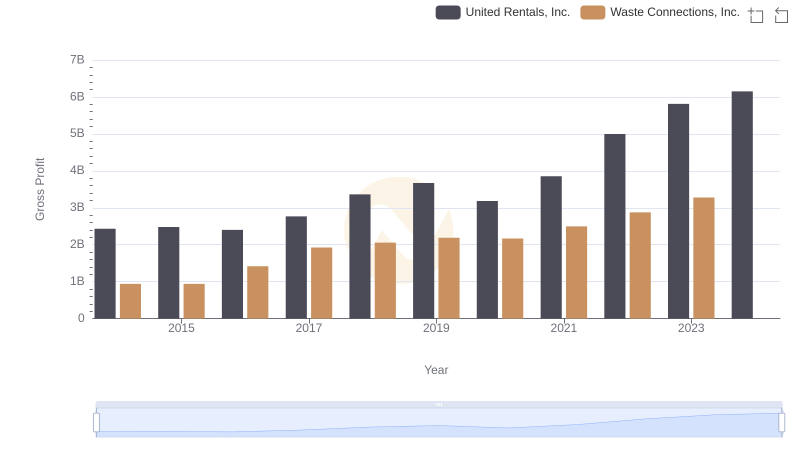
Gross Profit Trends Compared: United Rentals, Inc. vs Waste Connections, Inc.
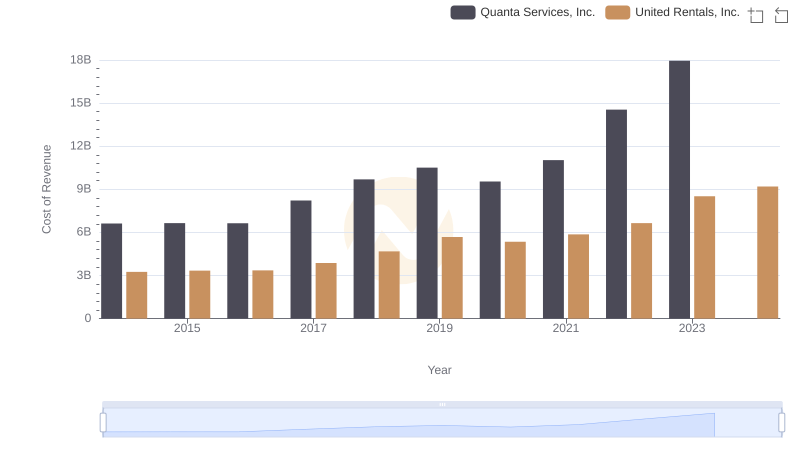
United Rentals, Inc. vs Quanta Services, Inc.: Efficiency in Cost of Revenue Explored
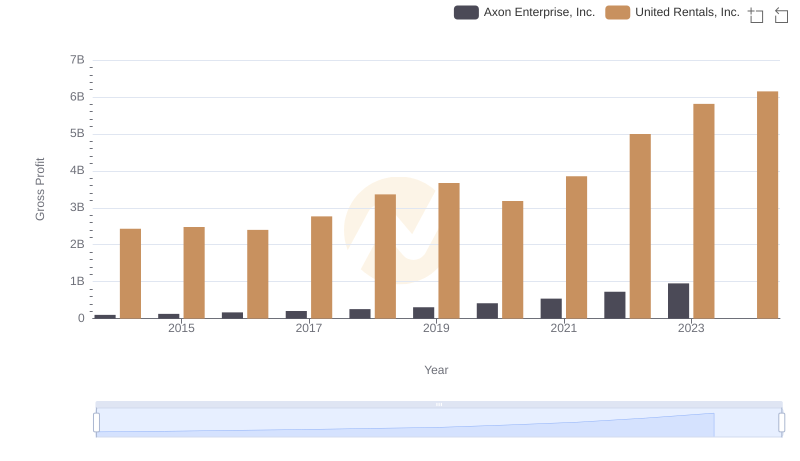
United Rentals, Inc. vs Axon Enterprise, Inc.: A Gross Profit Performance Breakdown
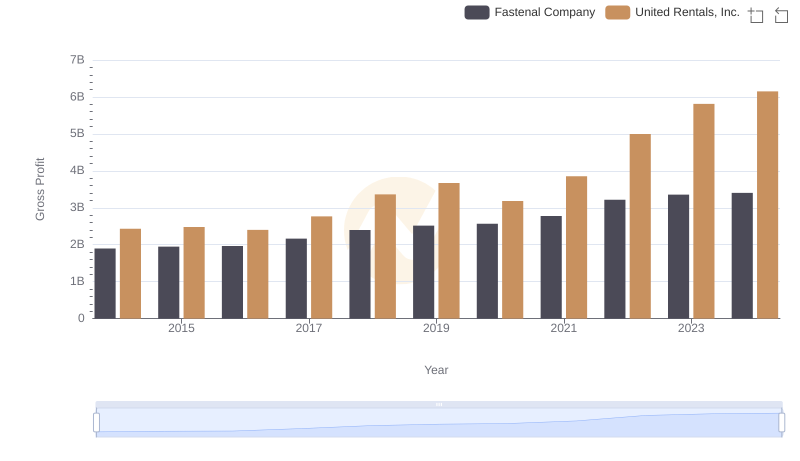
Gross Profit Comparison: United Rentals, Inc. and Fastenal Company Trends
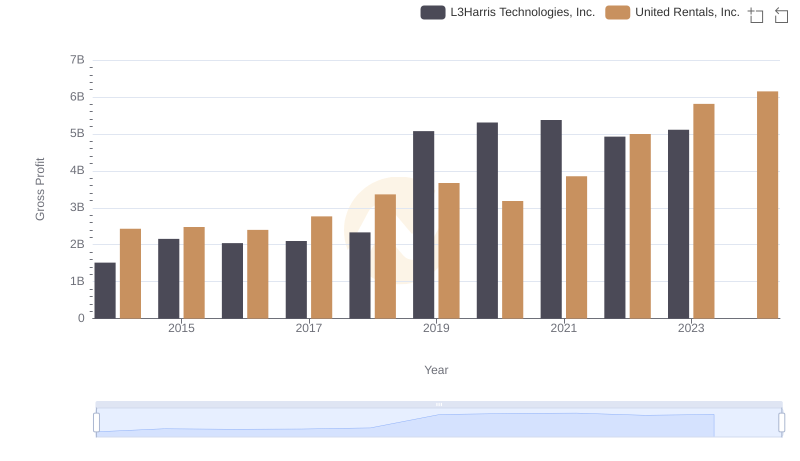
United Rentals, Inc. vs L3Harris Technologies, Inc.: A Gross Profit Performance Breakdown
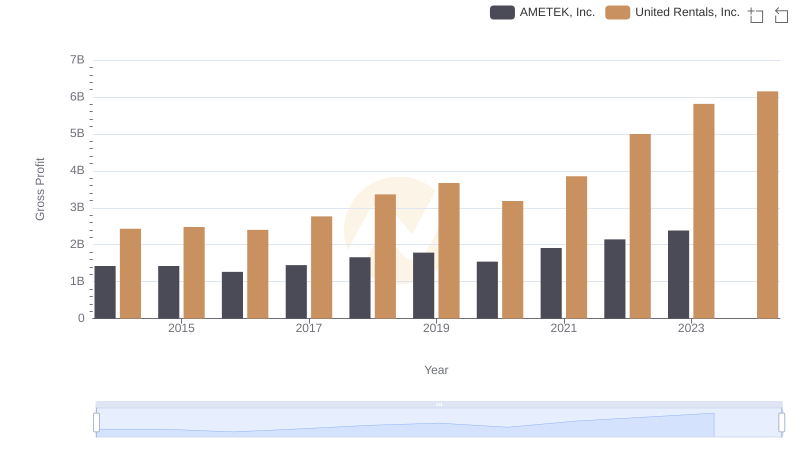
Gross Profit Analysis: Comparing United Rentals, Inc. and AMETEK, Inc.
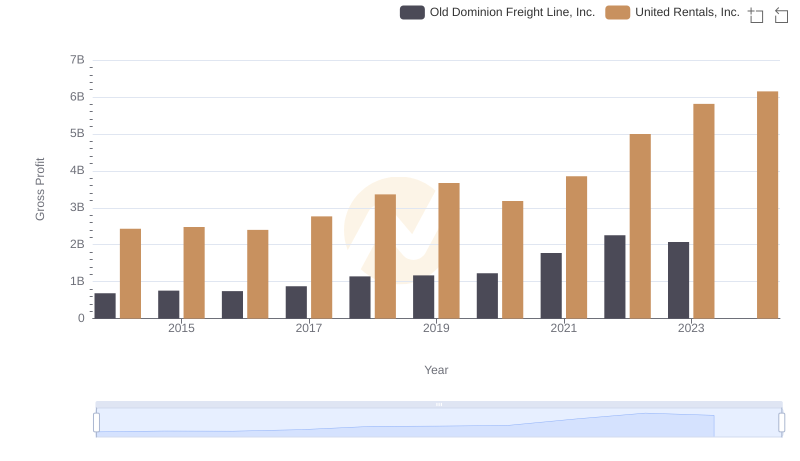
Gross Profit Comparison: United Rentals, Inc. and Old Dominion Freight Line, Inc. Trends
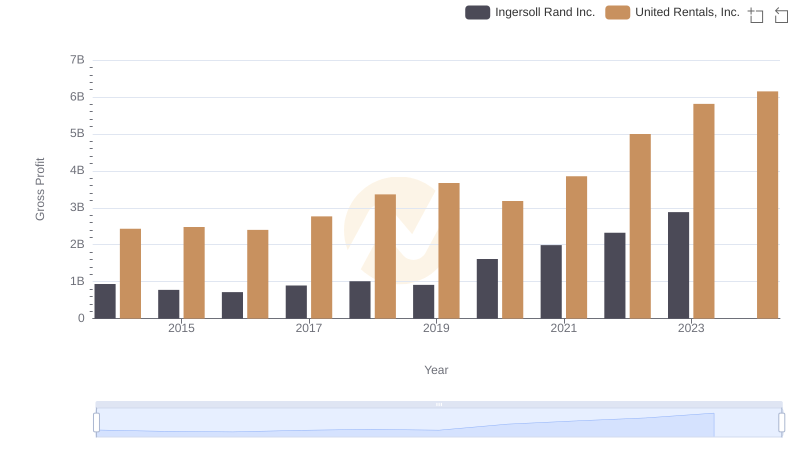
United Rentals, Inc. and Ingersoll Rand Inc.: A Detailed Gross Profit Analysis
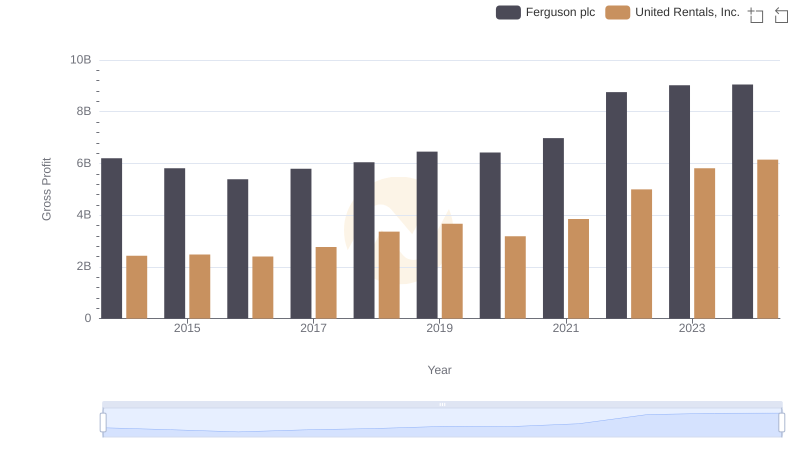
Key Insights on Gross Profit: United Rentals, Inc. vs Ferguson plc
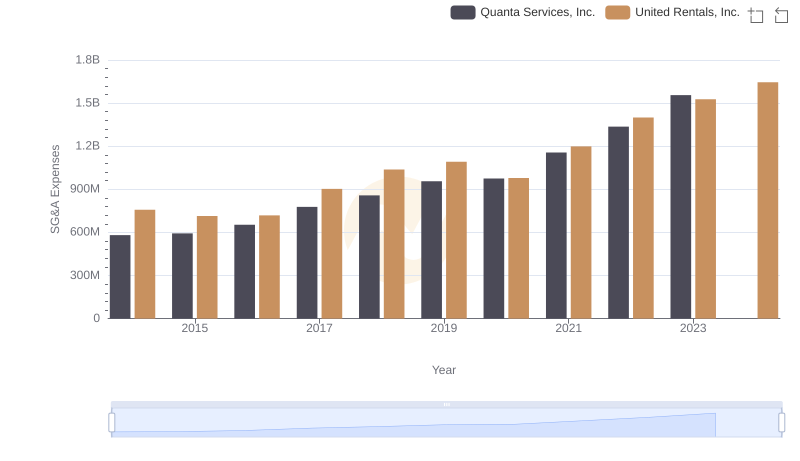
United Rentals, Inc. and Quanta Services, Inc.: SG&A Spending Patterns Compared
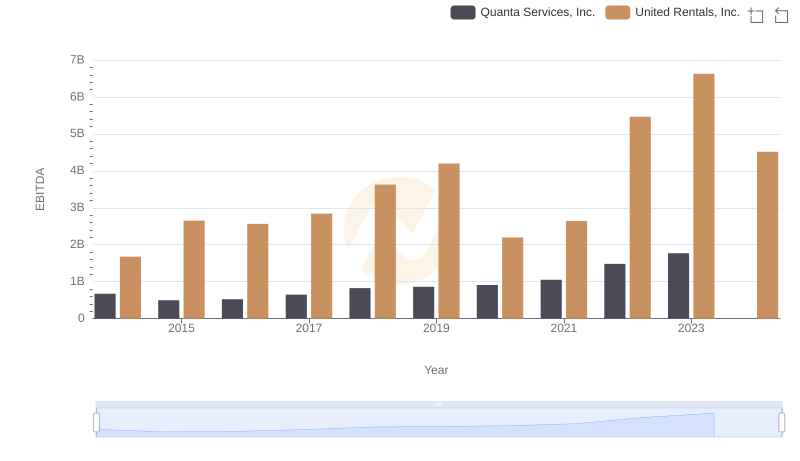
Comprehensive EBITDA Comparison: United Rentals, Inc. vs Quanta Services, Inc.