| __timestamp | Curtiss-Wright Corporation | United Rentals, Inc. |
|---|---|---|
| Wednesday, January 1, 2014 | 776516000 | 2432000000 |
| Thursday, January 1, 2015 | 783255000 | 2480000000 |
| Friday, January 1, 2016 | 750483000 | 2403000000 |
| Sunday, January 1, 2017 | 818595000 | 2769000000 |
| Monday, January 1, 2018 | 871261000 | 3364000000 |
| Tuesday, January 1, 2019 | 898745000 | 3670000000 |
| Wednesday, January 1, 2020 | 841227000 | 3183000000 |
| Friday, January 1, 2021 | 933356000 | 3853000000 |
| Saturday, January 1, 2022 | 954609000 | 4996000000 |
| Sunday, January 1, 2023 | 1067178000 | 5813000000 |
| Monday, January 1, 2024 | 1153549000 | 6150000000 |
Data in motion
In the ever-evolving landscape of industrial giants, United Rentals, Inc. and Curtiss-Wright Corporation have showcased intriguing trajectories in their gross profit margins over the past decade. From 2014 to 2023, United Rentals, Inc. has demonstrated a robust growth, with its gross profit surging by approximately 139%, reaching a peak in 2023. This impressive growth reflects the company's strategic expansions and market adaptability.
Conversely, Curtiss-Wright Corporation, while maintaining a steady upward trend, has seen a more modest increase of around 37% in the same period. The data highlights a significant leap in 2023, marking a 12% rise from the previous year, showcasing resilience amidst market challenges.
Interestingly, the data for 2024 reveals a gap for Curtiss-Wright Corporation, suggesting potential market shifts or reporting delays. This analysis underscores the dynamic nature of industrial profitability and the strategic maneuvers of these corporations.
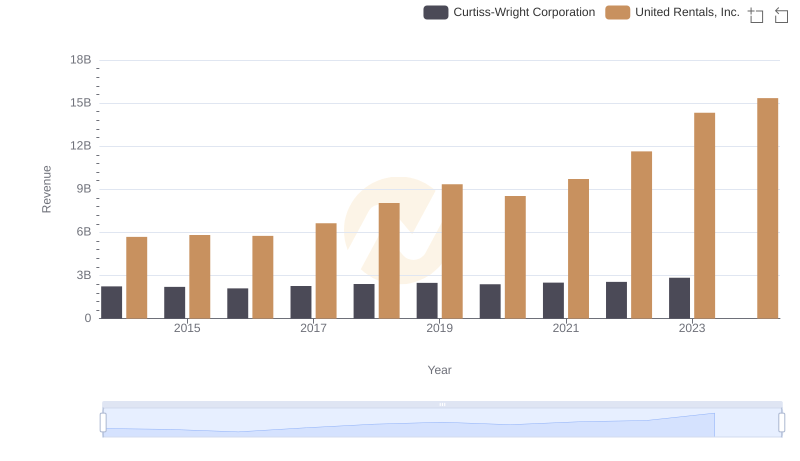
Who Generates More Revenue? United Rentals, Inc. or Curtiss-Wright Corporation
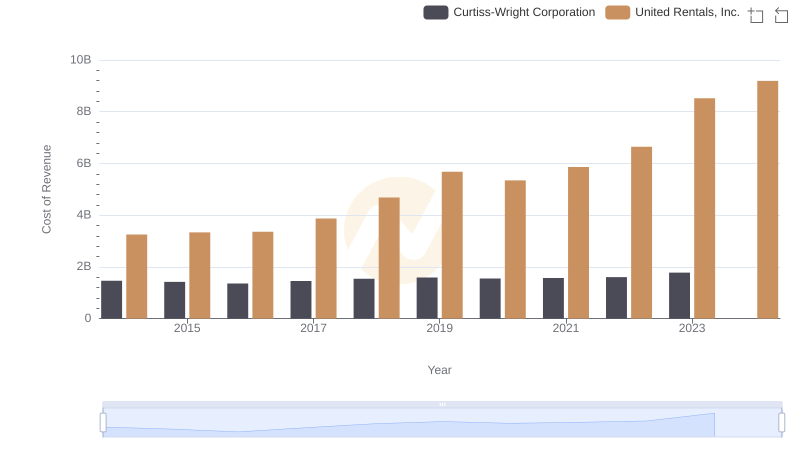
Cost of Revenue Trends: United Rentals, Inc. vs Curtiss-Wright Corporation
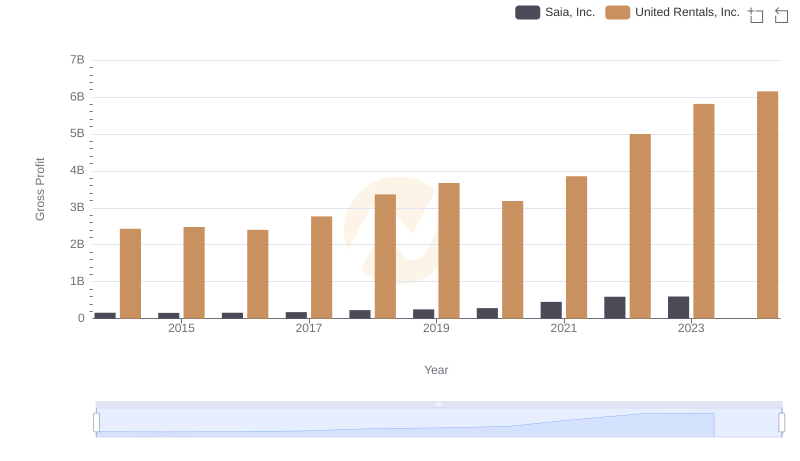
Gross Profit Comparison: United Rentals, Inc. and Saia, Inc. Trends

United Rentals, Inc. and Stanley Black & Decker, Inc.: A Detailed Gross Profit Analysis
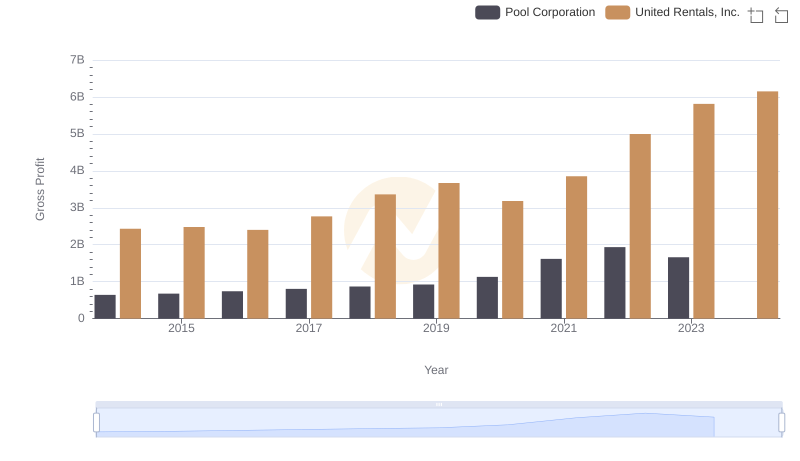
United Rentals, Inc. vs Pool Corporation: A Gross Profit Performance Breakdown

Gross Profit Comparison: United Rentals, Inc. and U-Haul Holding Company Trends
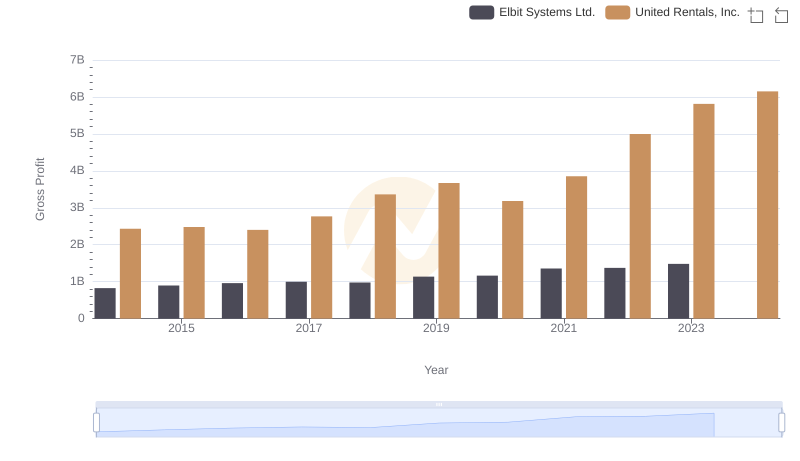
Gross Profit Analysis: Comparing United Rentals, Inc. and Elbit Systems Ltd.

Gross Profit Trends Compared: United Rentals, Inc. vs C.H. Robinson Worldwide, Inc.
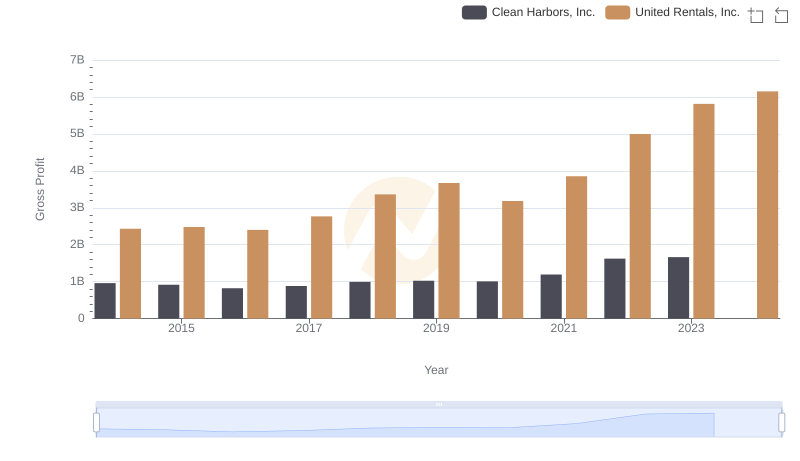
United Rentals, Inc. and Clean Harbors, Inc.: A Detailed Gross Profit Analysis
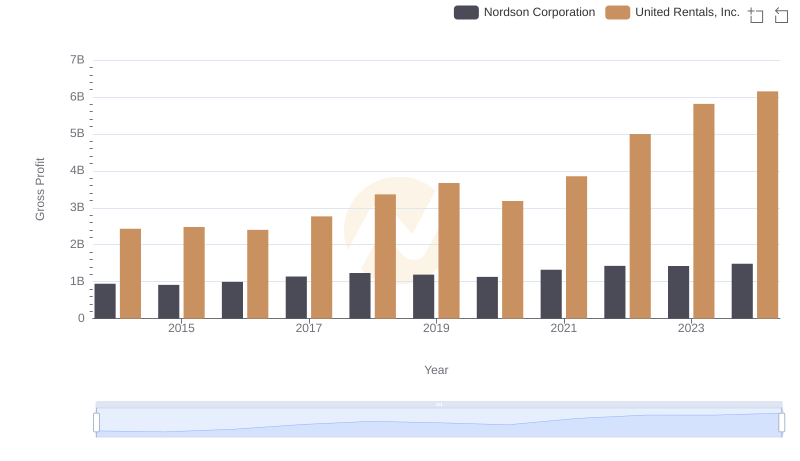
United Rentals, Inc. and Nordson Corporation: A Detailed Gross Profit Analysis

Comparing SG&A Expenses: United Rentals, Inc. vs Curtiss-Wright Corporation Trends and Insights
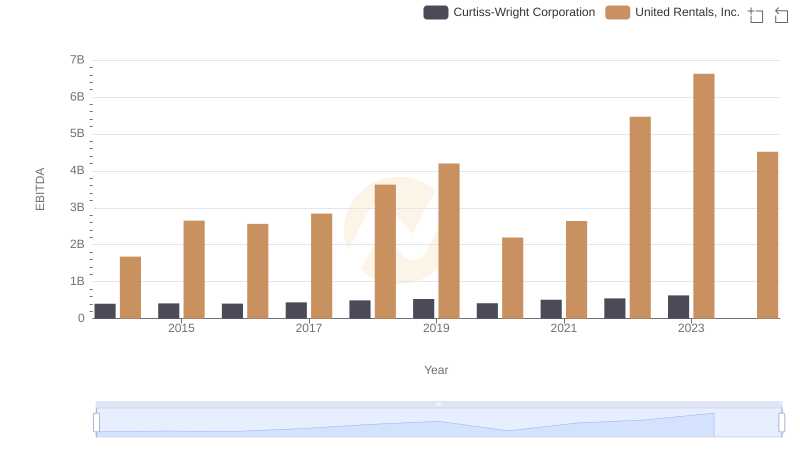
Comparative EBITDA Analysis: United Rentals, Inc. vs Curtiss-Wright Corporation