| __timestamp | AECOM | United Rentals, Inc. |
|---|---|---|
| Wednesday, January 1, 2014 | 403176000 | 2432000000 |
| Thursday, January 1, 2015 | 535188000 | 2480000000 |
| Friday, January 1, 2016 | 642824000 | 2403000000 |
| Sunday, January 1, 2017 | 683720000 | 2769000000 |
| Monday, January 1, 2018 | 650649000 | 3364000000 |
| Tuesday, January 1, 2019 | 813445000 | 3670000000 |
| Wednesday, January 1, 2020 | 709560000 | 3183000000 |
| Friday, January 1, 2021 | 798421000 | 3853000000 |
| Saturday, January 1, 2022 | 847974000 | 4996000000 |
| Sunday, January 1, 2023 | 945465000 | 5813000000 |
| Monday, January 1, 2024 | 1084341000 | 6150000000 |
Cracking the code
In the ever-evolving landscape of the construction and engineering sectors, United Rentals, Inc. and AECOM stand as titans. Over the past decade, United Rentals has consistently outperformed AECOM in terms of gross profit, showcasing a robust growth trajectory. From 2014 to 2024, United Rentals' gross profit surged by approximately 153%, reaching a peak in 2024. In contrast, AECOM's growth, while steady, was more modest, with a 169% increase over the same period.
The data reveals a compelling narrative of strategic expansion and market dominance. United Rentals' aggressive growth strategy is evident in its gross profit, which was consistently more than three times that of AECOM by 2024. This analysis underscores the importance of strategic investments and market positioning in achieving financial success in the competitive construction industry.
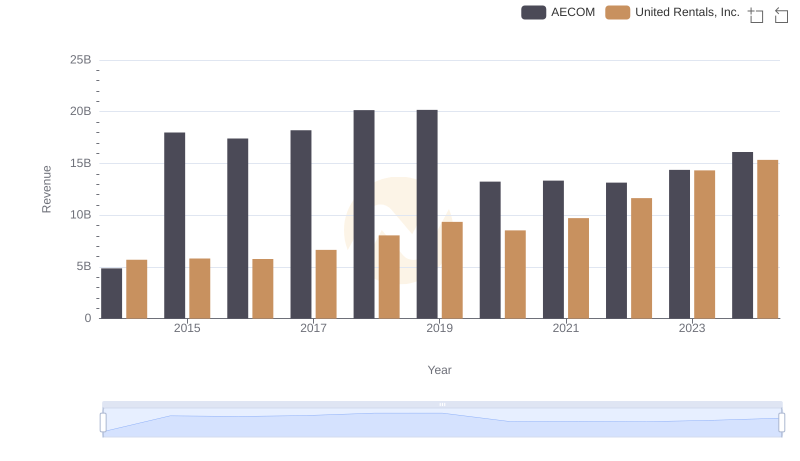
United Rentals, Inc. or AECOM: Who Leads in Yearly Revenue?
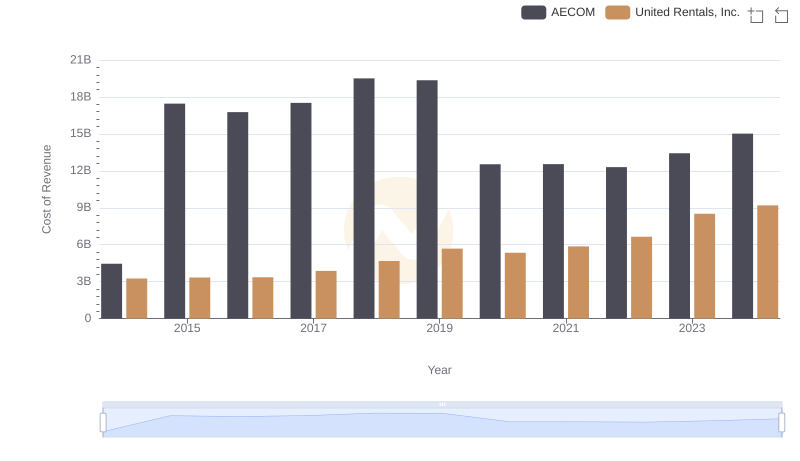
Cost of Revenue Comparison: United Rentals, Inc. vs AECOM
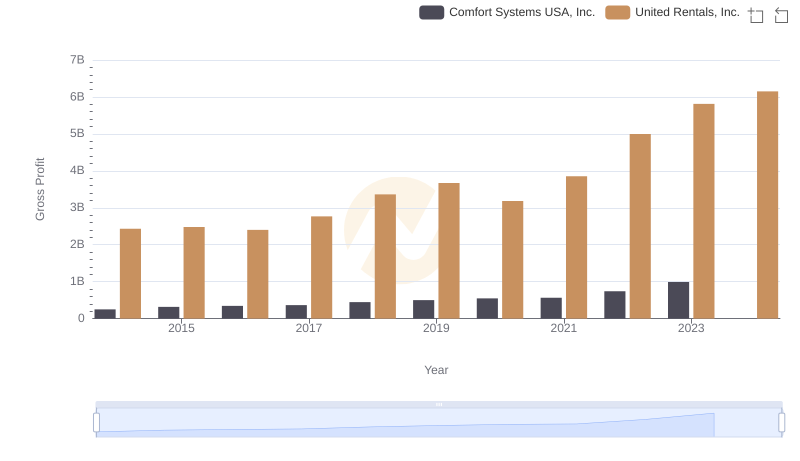
Gross Profit Trends Compared: United Rentals, Inc. vs Comfort Systems USA, Inc.
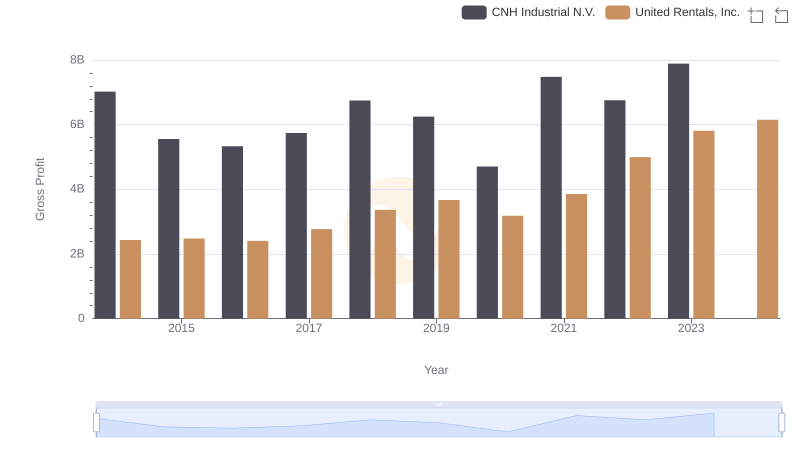
Gross Profit Analysis: Comparing United Rentals, Inc. and CNH Industrial N.V.
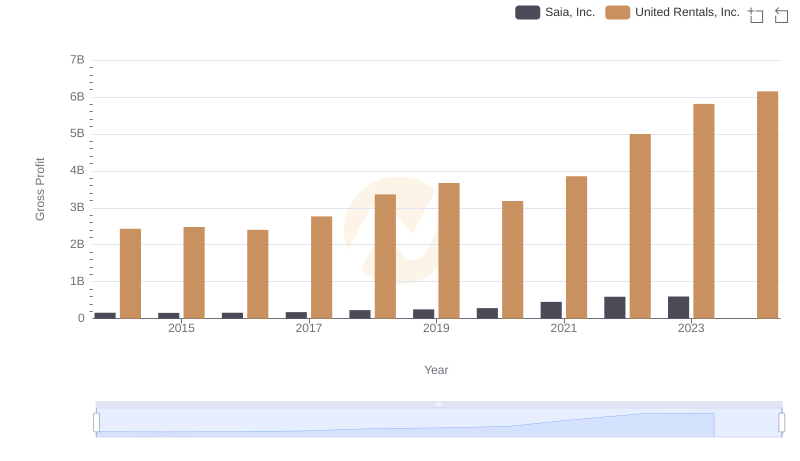
Gross Profit Comparison: United Rentals, Inc. and Saia, Inc. Trends

United Rentals, Inc. and Stanley Black & Decker, Inc.: A Detailed Gross Profit Analysis
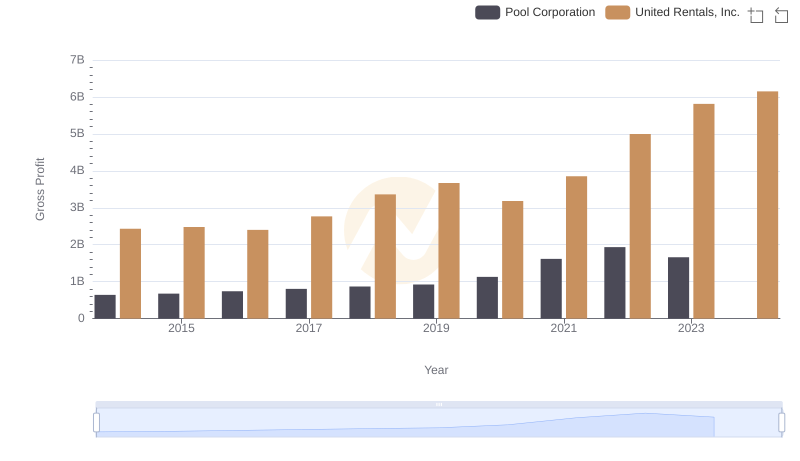
United Rentals, Inc. vs Pool Corporation: A Gross Profit Performance Breakdown

Gross Profit Comparison: United Rentals, Inc. and U-Haul Holding Company Trends
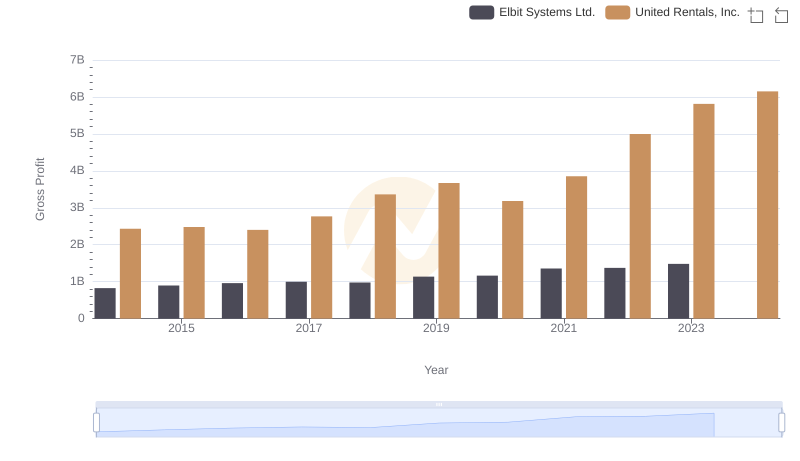
Gross Profit Analysis: Comparing United Rentals, Inc. and Elbit Systems Ltd.

Gross Profit Trends Compared: United Rentals, Inc. vs C.H. Robinson Worldwide, Inc.
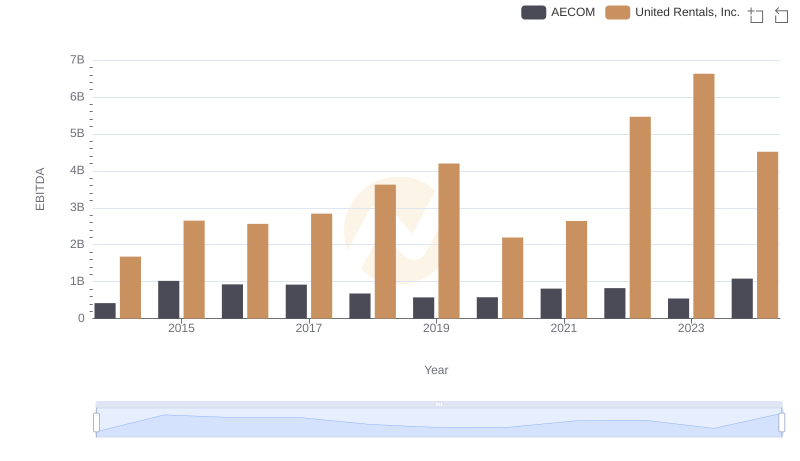
A Professional Review of EBITDA: United Rentals, Inc. Compared to AECOM