| __timestamp | Expeditors International of Washington, Inc. | United Rentals, Inc. |
|---|---|---|
| Wednesday, January 1, 2014 | 38125000 | 758000000 |
| Thursday, January 1, 2015 | 41990000 | 714000000 |
| Friday, January 1, 2016 | 41763000 | 719000000 |
| Sunday, January 1, 2017 | 44290000 | 903000000 |
| Monday, January 1, 2018 | 45346000 | 1038000000 |
| Tuesday, January 1, 2019 | 44002000 | 1092000000 |
| Wednesday, January 1, 2020 | 18436000 | 979000000 |
| Friday, January 1, 2021 | 16026000 | 1199000000 |
| Saturday, January 1, 2022 | 24293000 | 1400000000 |
| Sunday, January 1, 2023 | 27913000 | 1527000000 |
| Monday, January 1, 2024 | 33331000 | 1645000000 |
Cracking the code
In the ever-evolving landscape of corporate finance, understanding the nuances of Selling, General, and Administrative (SG&A) expenses is crucial for investors and analysts alike. This analysis delves into the SG&A expenses of two industry giants: United Rentals, Inc. and Expeditors International of Washington, Inc., from 2014 to 2023.
United Rentals, a leader in equipment rental, has seen a consistent upward trend in SG&A expenses, peaking at approximately $1.53 billion in 2023, marking a 102% increase from 2014. This growth reflects the company's strategic expansion and increased operational scale. In contrast, Expeditors International, a global logistics company, experienced a more volatile SG&A trajectory, with expenses fluctuating between $16 million and $45 million. Notably, 2020 marked a significant dip, likely due to pandemic-related disruptions.
This comparative insight underscores the diverse financial strategies and market conditions impacting these two distinct sectors.
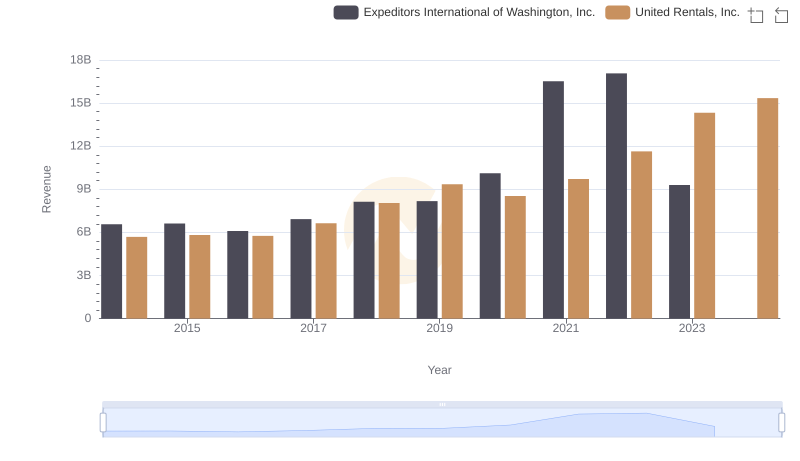
Comparing Revenue Performance: United Rentals, Inc. or Expeditors International of Washington, Inc.?

Cost of Revenue: Key Insights for United Rentals, Inc. and Expeditors International of Washington, Inc.
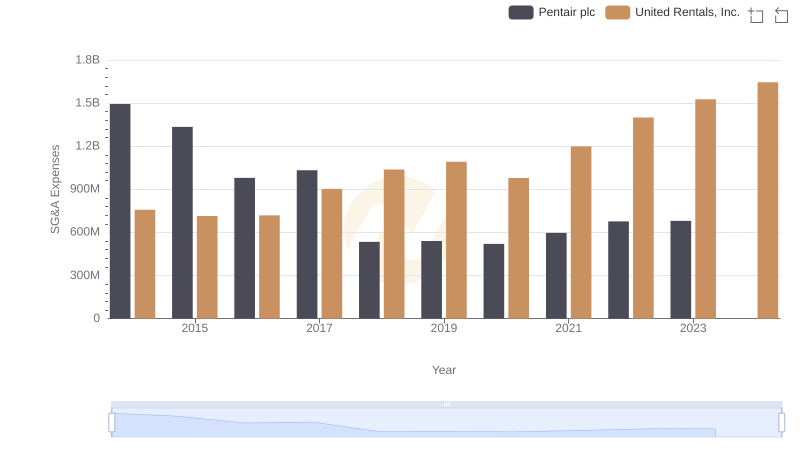
United Rentals, Inc. vs Pentair plc: SG&A Expense Trends
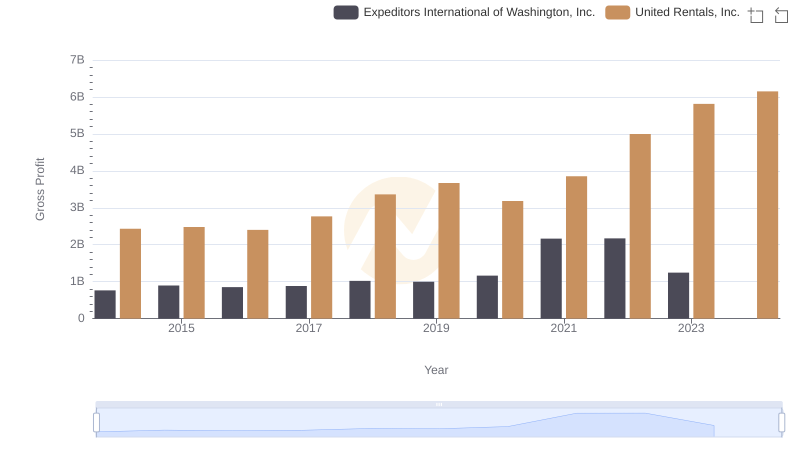
United Rentals, Inc. vs Expeditors International of Washington, Inc.: A Gross Profit Performance Breakdown
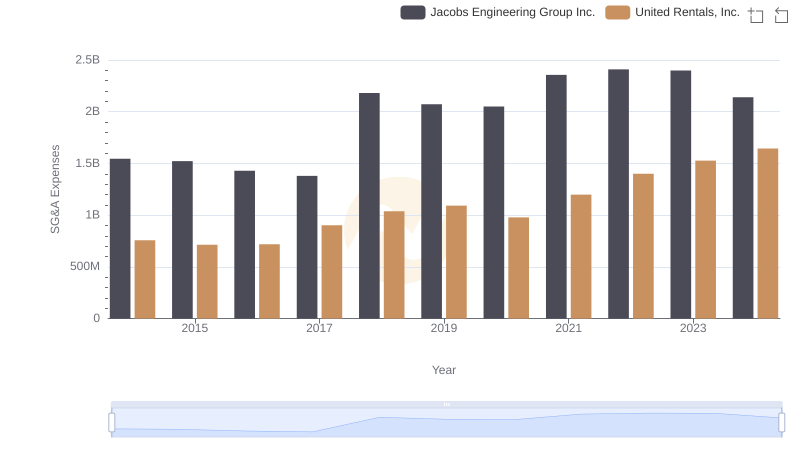
Who Optimizes SG&A Costs Better? United Rentals, Inc. or Jacobs Engineering Group Inc.
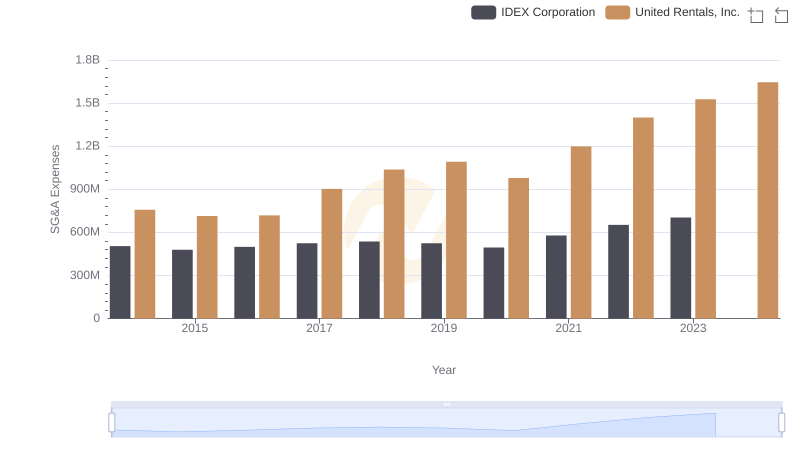
United Rentals, Inc. and IDEX Corporation: SG&A Spending Patterns Compared
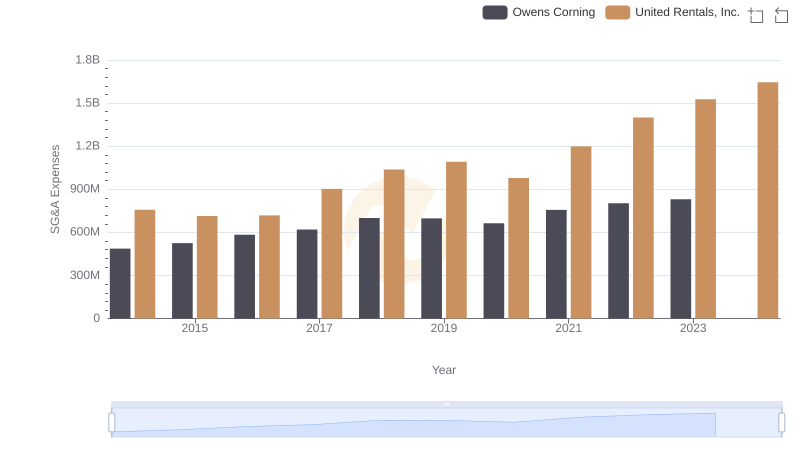
Breaking Down SG&A Expenses: United Rentals, Inc. vs Owens Corning
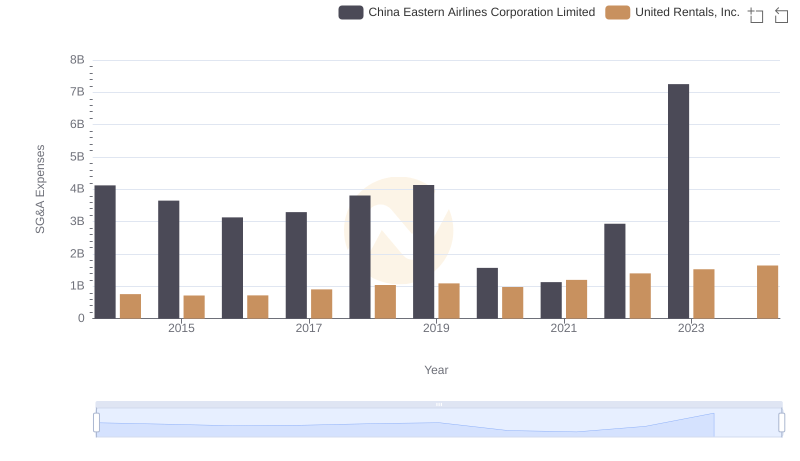
United Rentals, Inc. or China Eastern Airlines Corporation Limited: Who Manages SG&A Costs Better?
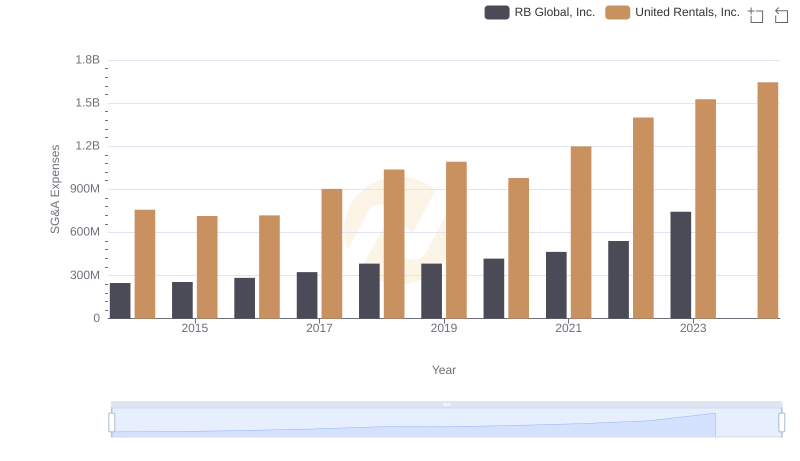
United Rentals, Inc. and RB Global, Inc.: SG&A Spending Patterns Compared
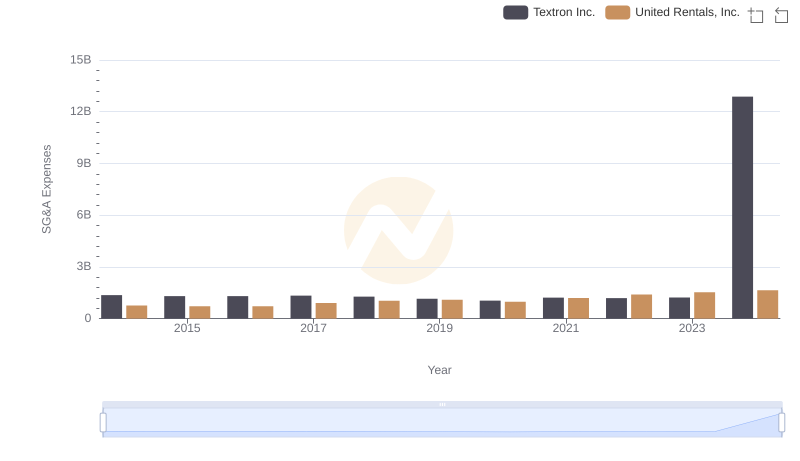
Comparing SG&A Expenses: United Rentals, Inc. vs Textron Inc. Trends and Insights
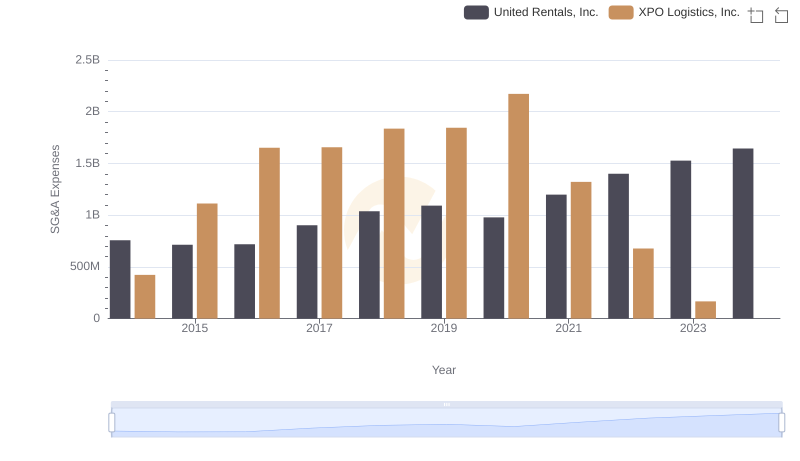
Operational Costs Compared: SG&A Analysis of United Rentals, Inc. and XPO Logistics, Inc.
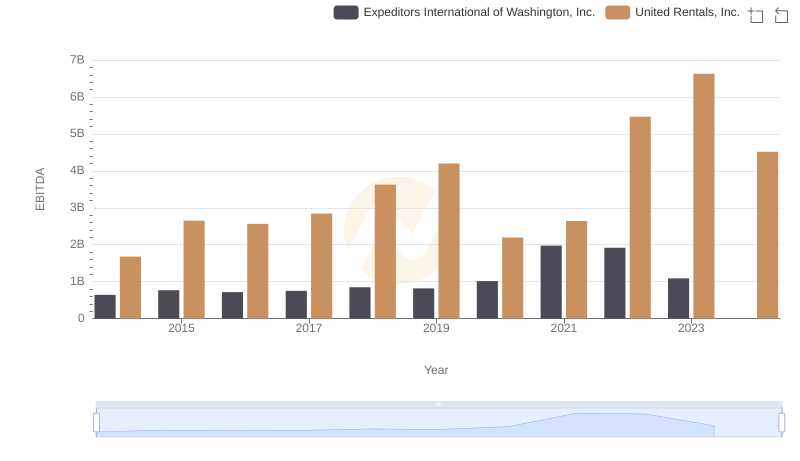
A Side-by-Side Analysis of EBITDA: United Rentals, Inc. and Expeditors International of Washington, Inc.