| __timestamp | United Rentals, Inc. | XPO Logistics, Inc. |
|---|---|---|
| Wednesday, January 1, 2014 | 5685000000 | 2356600000 |
| Thursday, January 1, 2015 | 5817000000 | 7623200000 |
| Friday, January 1, 2016 | 5762000000 | 14619400000 |
| Sunday, January 1, 2017 | 6641000000 | 15380800000 |
| Monday, January 1, 2018 | 8047000000 | 17279000000 |
| Tuesday, January 1, 2019 | 9351000000 | 16648000000 |
| Wednesday, January 1, 2020 | 8530000000 | 16252000000 |
| Friday, January 1, 2021 | 9716000000 | 12806000000 |
| Saturday, January 1, 2022 | 11642000000 | 7718000000 |
| Sunday, January 1, 2023 | 14332000000 | 7744000000 |
| Monday, January 1, 2024 | 15345000000 | 8072000000 |
Unveiling the hidden dimensions of data
In the dynamic world of logistics and equipment rental, United Rentals, Inc. and XPO Logistics, Inc. have carved out significant market positions. Over the past decade, United Rentals has seen its revenue grow by approximately 170%, from $5.7 billion in 2014 to an impressive $15.3 billion in 2024. This growth trajectory highlights the company's strategic expansions and robust market demand.
Conversely, XPO Logistics experienced a peak in 2018 with revenues reaching $17.3 billion, but recent years have shown a decline, with 2023 revenues at $7.7 billion. This shift may reflect strategic divestitures or market challenges.
The data reveals a compelling narrative of growth and adaptation, underscoring the importance of strategic agility in the ever-evolving logistics and rental sectors. As we look to the future, these trends offer valuable insights into the competitive landscape of these industries.
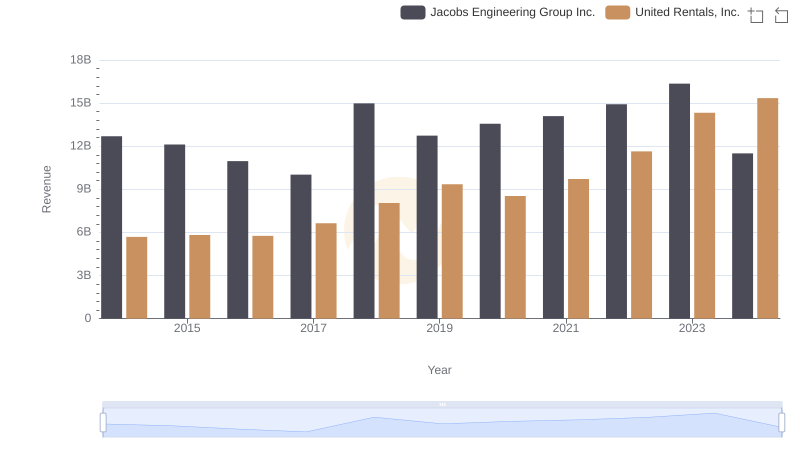
United Rentals, Inc. vs Jacobs Engineering Group Inc.: Annual Revenue Growth Compared
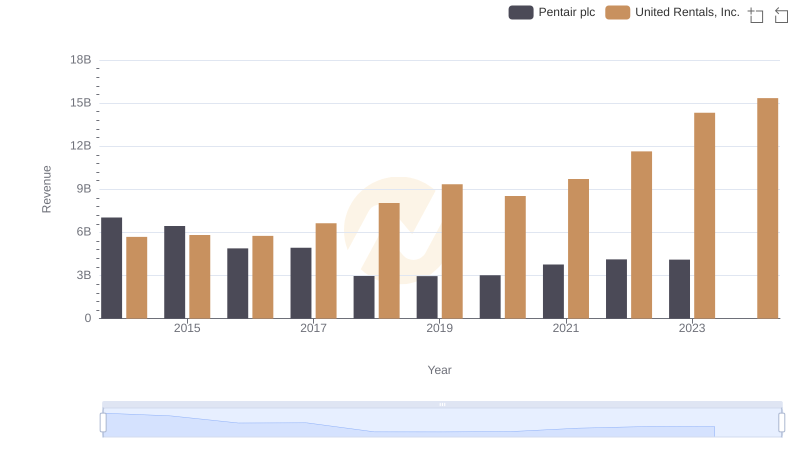
Revenue Showdown: United Rentals, Inc. vs Pentair plc
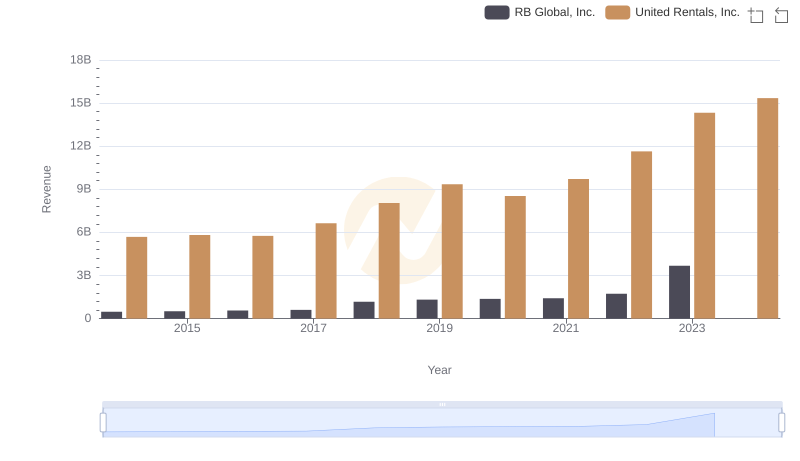
Revenue Insights: United Rentals, Inc. and RB Global, Inc. Performance Compared
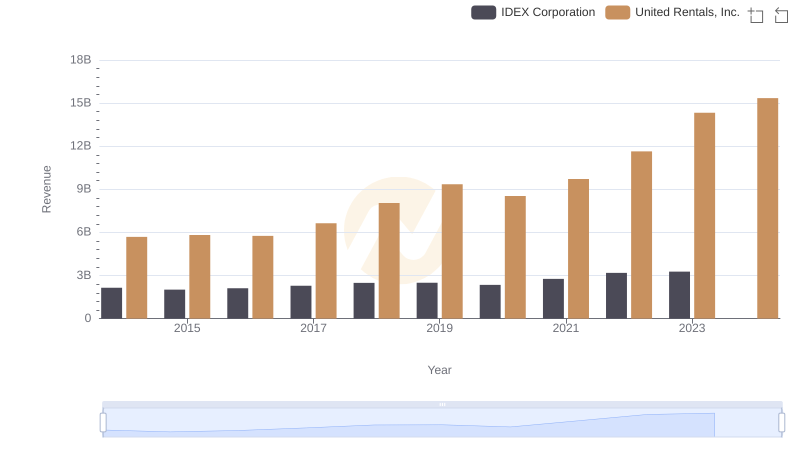
United Rentals, Inc. and IDEX Corporation: A Comprehensive Revenue Analysis
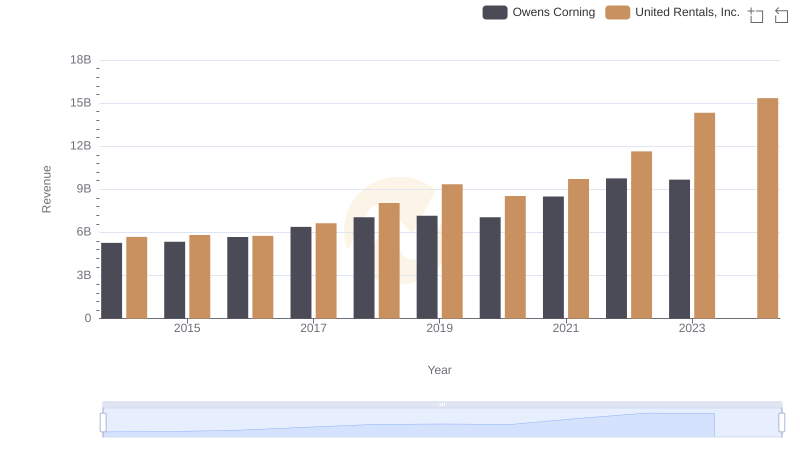
United Rentals, Inc. vs Owens Corning: Annual Revenue Growth Compared
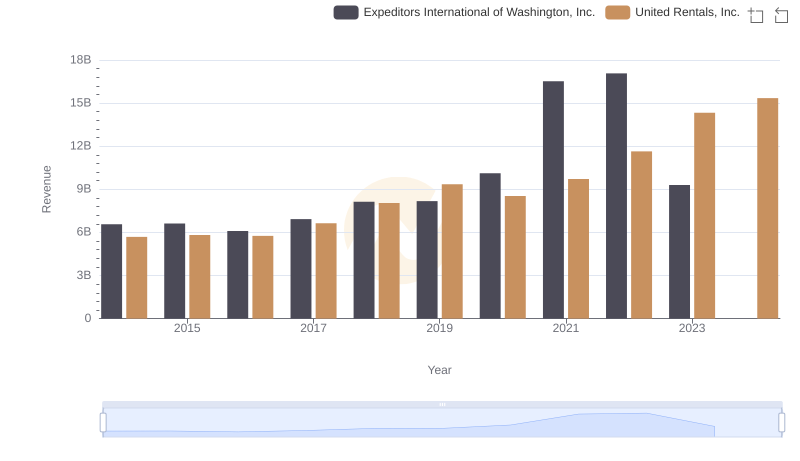
Comparing Revenue Performance: United Rentals, Inc. or Expeditors International of Washington, Inc.?
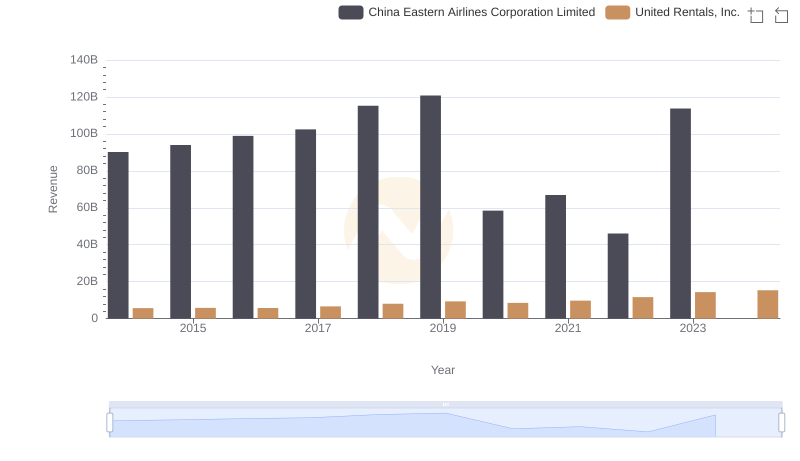
Revenue Insights: United Rentals, Inc. and China Eastern Airlines Corporation Limited Performance Compared
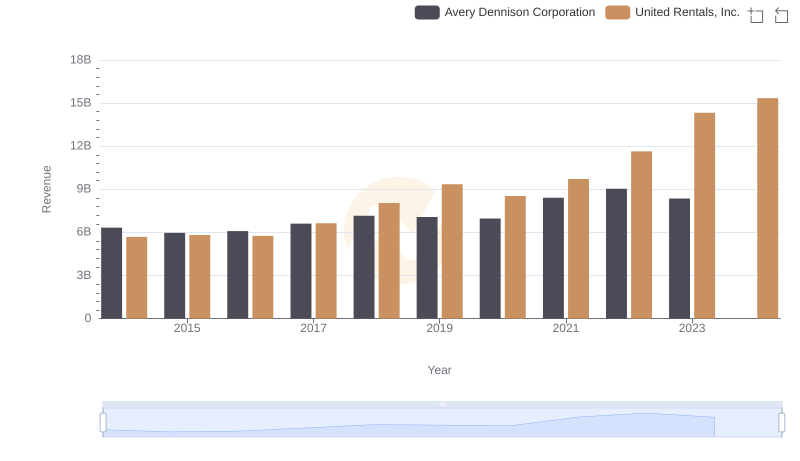
United Rentals, Inc. vs Avery Dennison Corporation: Examining Key Revenue Metrics
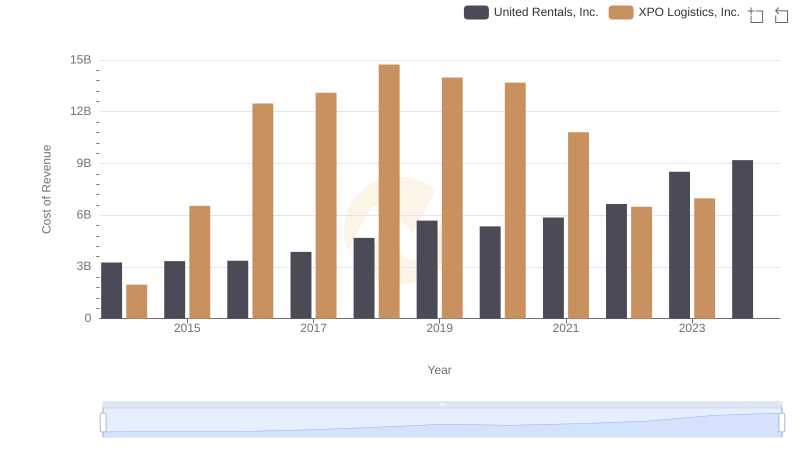
Cost of Revenue Trends: United Rentals, Inc. vs XPO Logistics, Inc.
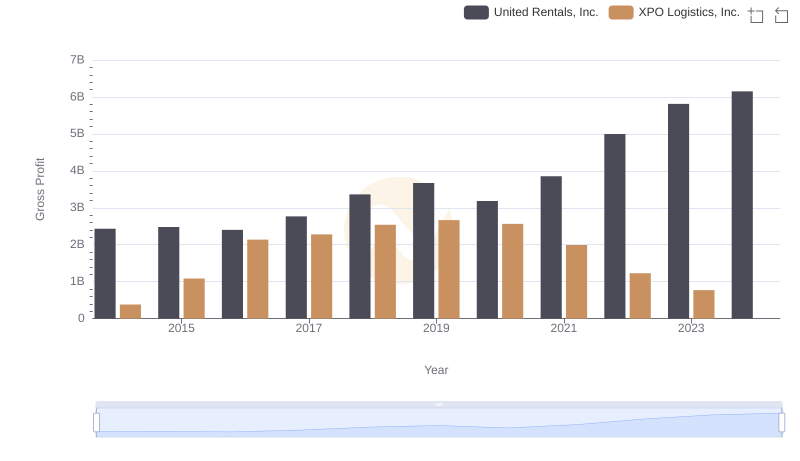
United Rentals, Inc. vs XPO Logistics, Inc.: A Gross Profit Performance Breakdown
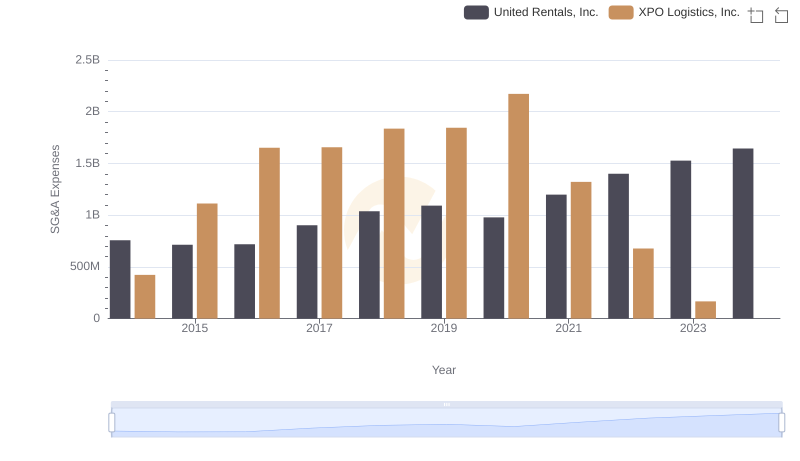
Operational Costs Compared: SG&A Analysis of United Rentals, Inc. and XPO Logistics, Inc.
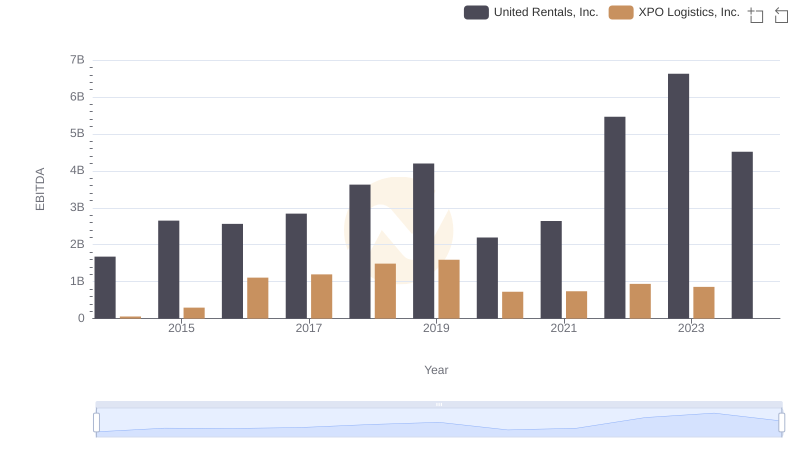
EBITDA Performance Review: United Rentals, Inc. vs XPO Logistics, Inc.