| __timestamp | Avery Dennison Corporation | United Rentals, Inc. |
|---|---|---|
| Wednesday, January 1, 2014 | 6330300000 | 5685000000 |
| Thursday, January 1, 2015 | 5966900000 | 5817000000 |
| Friday, January 1, 2016 | 6086500000 | 5762000000 |
| Sunday, January 1, 2017 | 6613800000 | 6641000000 |
| Monday, January 1, 2018 | 7159000000 | 8047000000 |
| Tuesday, January 1, 2019 | 7070100000 | 9351000000 |
| Wednesday, January 1, 2020 | 6971500000 | 8530000000 |
| Friday, January 1, 2021 | 8408300000 | 9716000000 |
| Saturday, January 1, 2022 | 9039300000 | 11642000000 |
| Sunday, January 1, 2023 | 8364299999 | 14332000000 |
| Monday, January 1, 2024 | 8755700000 | 15345000000 |
In pursuit of knowledge
In the ever-evolving landscape of industrial and manufacturing sectors, United Rentals, Inc. and Avery Dennison Corporation stand as titans, each carving a unique path to success. Over the past decade, United Rentals has demonstrated a remarkable growth trajectory, with revenue surging by approximately 170% from 2014 to 2023. This growth underscores its strategic expansions and robust market demand.
Conversely, Avery Dennison has shown steady progress, with a revenue increase of around 32% over the same period. Despite a dip in 2015, the company rebounded, peaking in 2022. However, 2023 saw a slight decline, hinting at potential market challenges or strategic shifts.
As we look to the future, the absence of Avery Dennison's 2024 data leaves room for speculation. Will it regain its upward momentum, or will United Rentals continue to dominate the revenue race?
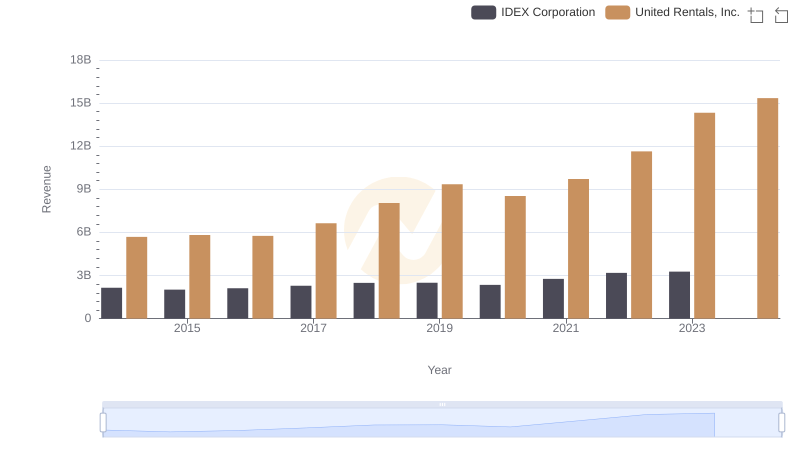
United Rentals, Inc. and IDEX Corporation: A Comprehensive Revenue Analysis
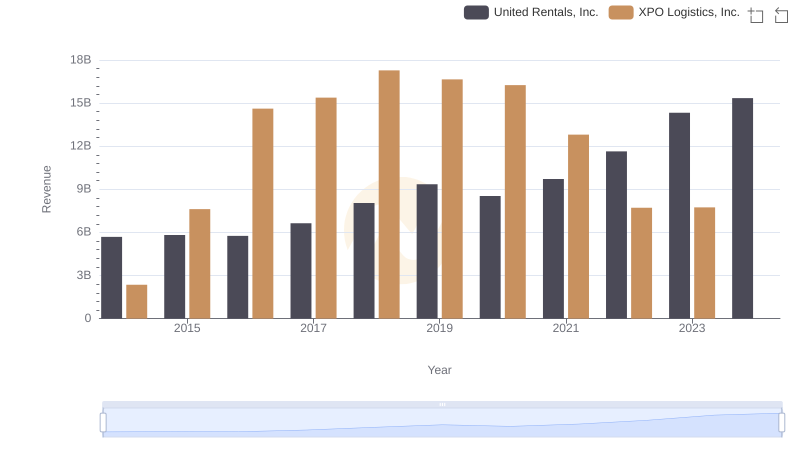
United Rentals, Inc. and XPO Logistics, Inc.: A Comprehensive Revenue Analysis
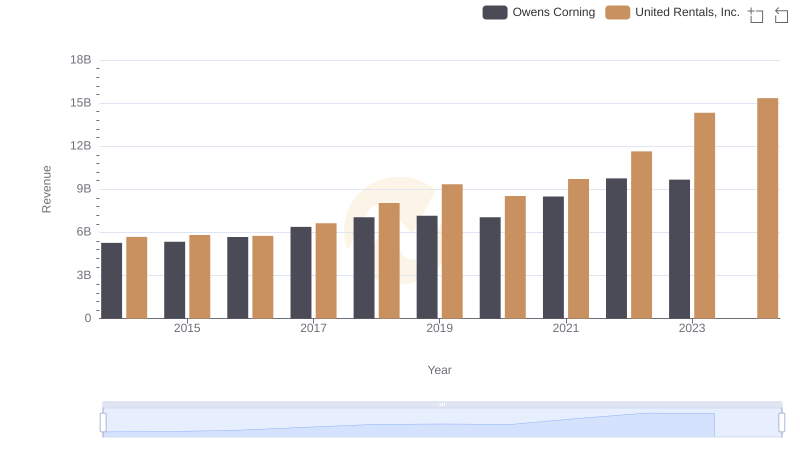
United Rentals, Inc. vs Owens Corning: Annual Revenue Growth Compared
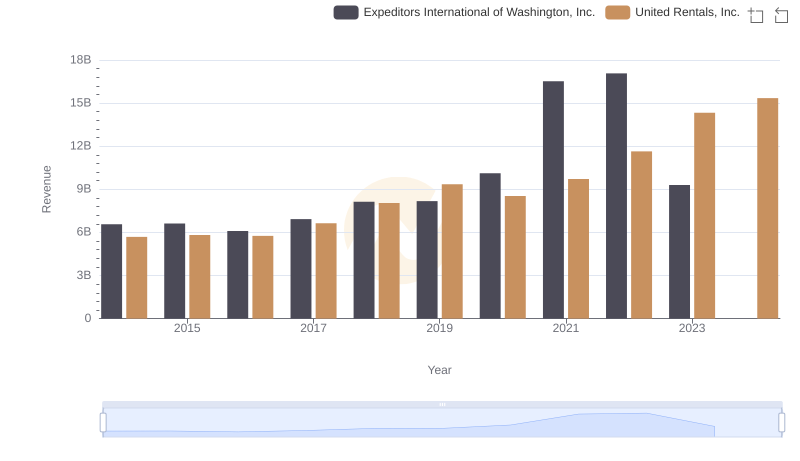
Comparing Revenue Performance: United Rentals, Inc. or Expeditors International of Washington, Inc.?
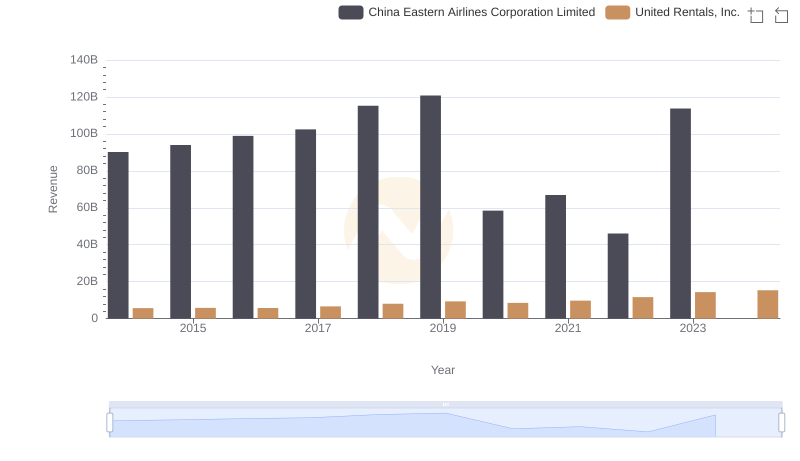
Revenue Insights: United Rentals, Inc. and China Eastern Airlines Corporation Limited Performance Compared
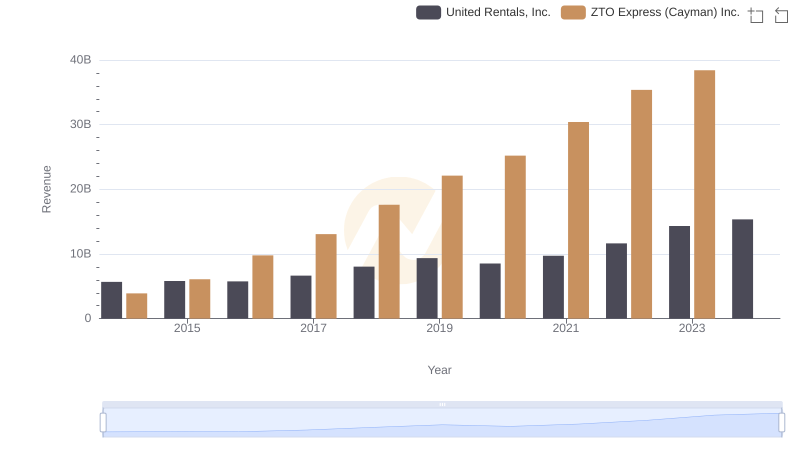
United Rentals, Inc. and ZTO Express (Cayman) Inc.: A Comprehensive Revenue Analysis
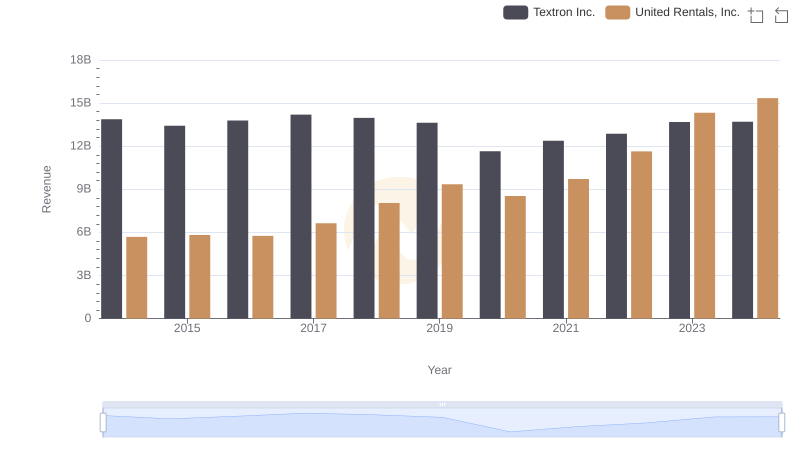
Revenue Insights: United Rentals, Inc. and Textron Inc. Performance Compared
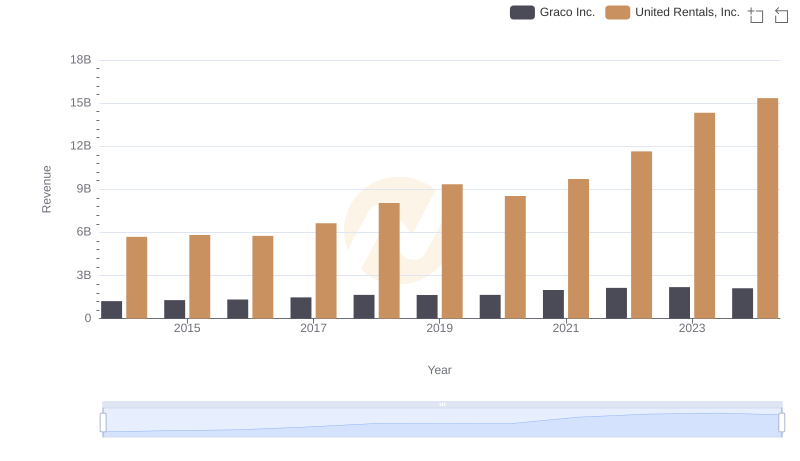
Who Generates More Revenue? United Rentals, Inc. or Graco Inc.
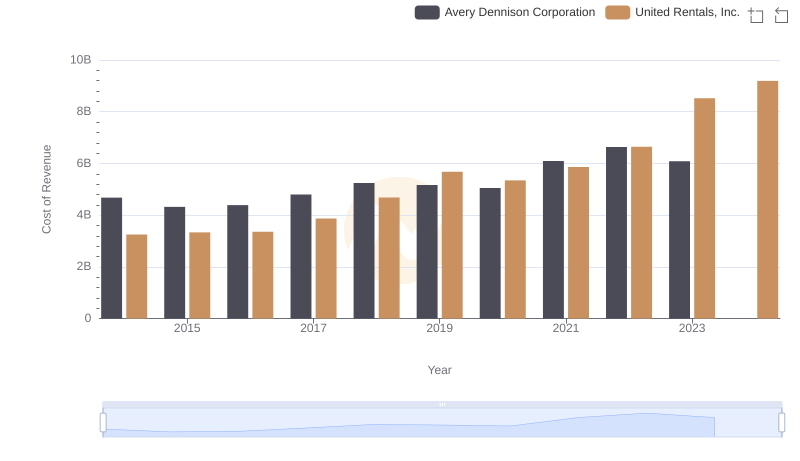
Analyzing Cost of Revenue: United Rentals, Inc. and Avery Dennison Corporation

United Rentals, Inc. and Avery Dennison Corporation: A Detailed Gross Profit Analysis
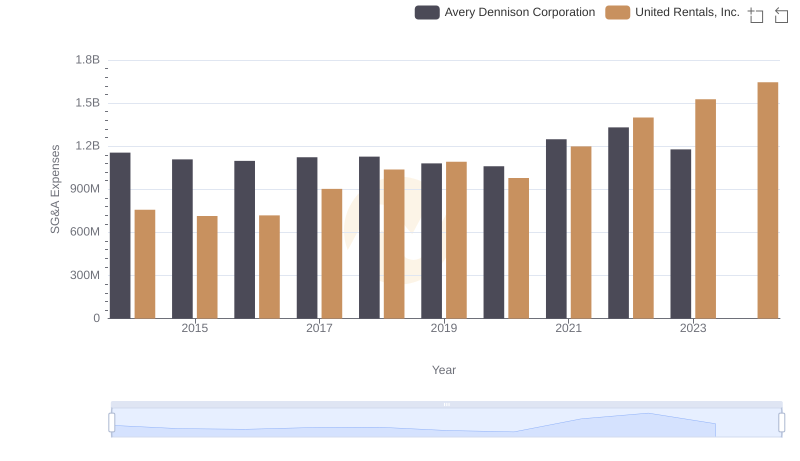
United Rentals, Inc. or Avery Dennison Corporation: Who Manages SG&A Costs Better?
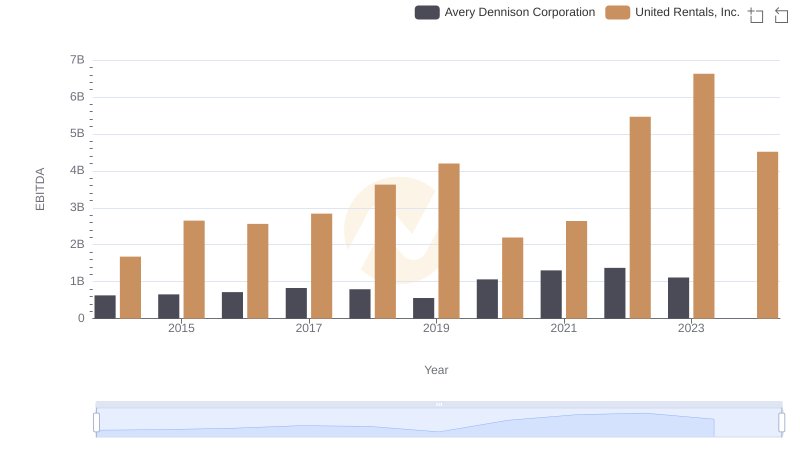
Comparative EBITDA Analysis: United Rentals, Inc. vs Avery Dennison Corporation