| __timestamp | United Rentals, Inc. | XPO Logistics, Inc. |
|---|---|---|
| Wednesday, January 1, 2014 | 758000000 | 422500000 |
| Thursday, January 1, 2015 | 714000000 | 1113400000 |
| Friday, January 1, 2016 | 719000000 | 1651200000 |
| Sunday, January 1, 2017 | 903000000 | 1656500000 |
| Monday, January 1, 2018 | 1038000000 | 1837000000 |
| Tuesday, January 1, 2019 | 1092000000 | 1845000000 |
| Wednesday, January 1, 2020 | 979000000 | 2172000000 |
| Friday, January 1, 2021 | 1199000000 | 1322000000 |
| Saturday, January 1, 2022 | 1400000000 | 678000000 |
| Sunday, January 1, 2023 | 1527000000 | 167000000 |
| Monday, January 1, 2024 | 1645000000 | 134000000 |
Unveiling the hidden dimensions of data
In the ever-evolving landscape of operational costs, Selling, General, and Administrative (SG&A) expenses serve as a critical indicator of a company's efficiency and strategic focus. Over the past decade, United Rentals, Inc. and XPO Logistics, Inc. have showcased contrasting trajectories in their SG&A expenditures.
From 2014 to 2023, United Rentals saw a steady increase in SG&A expenses, peaking in 2023 with a 116% rise from 2014. This growth reflects their aggressive expansion and market consolidation strategies. In contrast, XPO Logistics experienced a volatile pattern, with a significant 80% drop in SG&A expenses from 2020 to 2023, indicating a strategic shift or restructuring.
These trends highlight the dynamic nature of operational strategies in the logistics and rental sectors, offering valuable insights for investors and industry analysts alike.
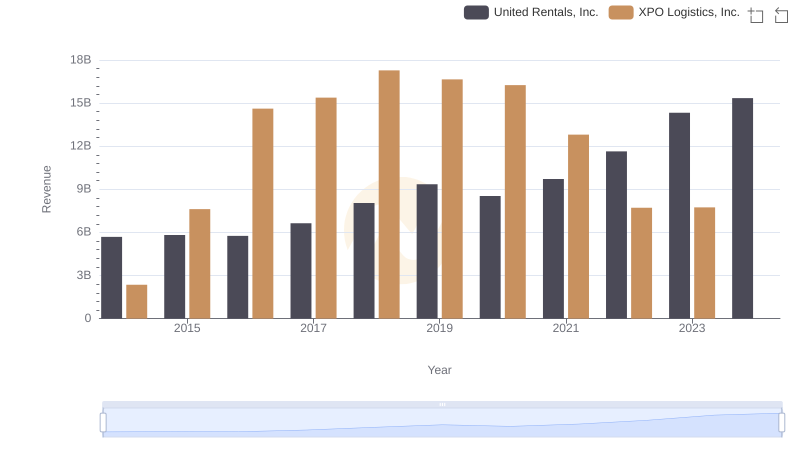
United Rentals, Inc. and XPO Logistics, Inc.: A Comprehensive Revenue Analysis
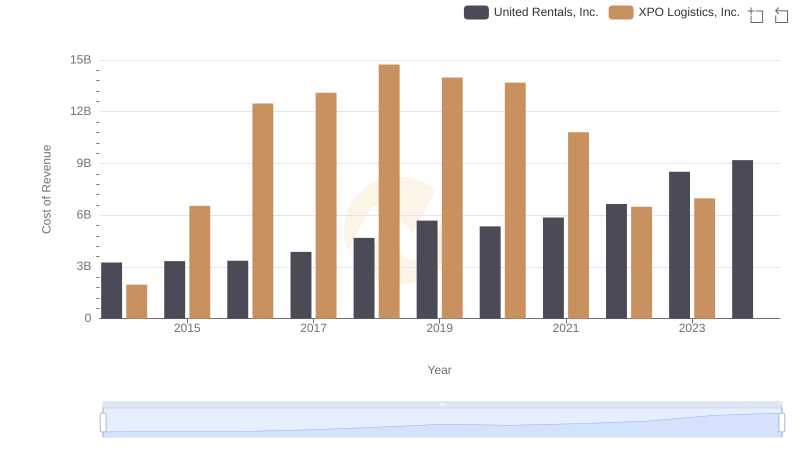
Cost of Revenue Trends: United Rentals, Inc. vs XPO Logistics, Inc.
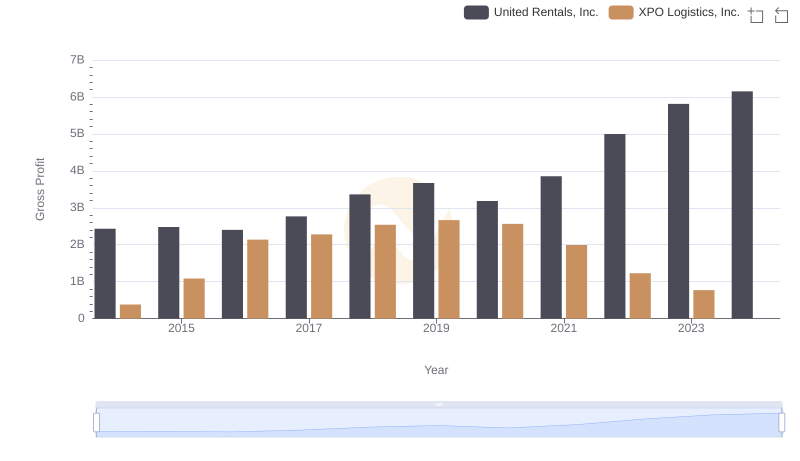
United Rentals, Inc. vs XPO Logistics, Inc.: A Gross Profit Performance Breakdown
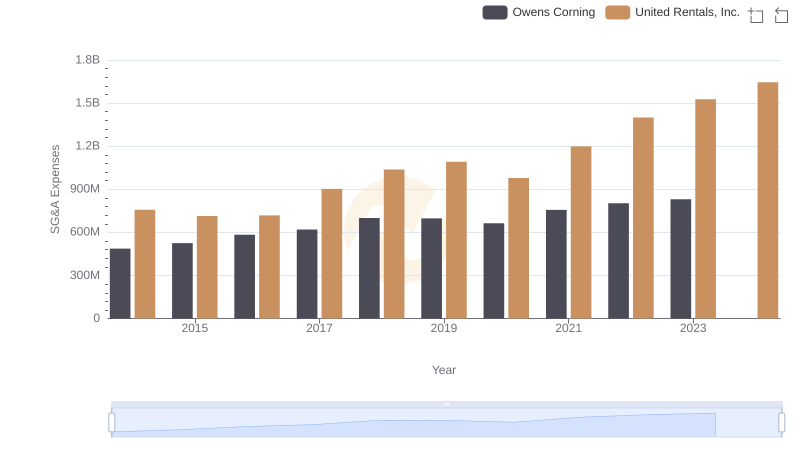
Breaking Down SG&A Expenses: United Rentals, Inc. vs Owens Corning
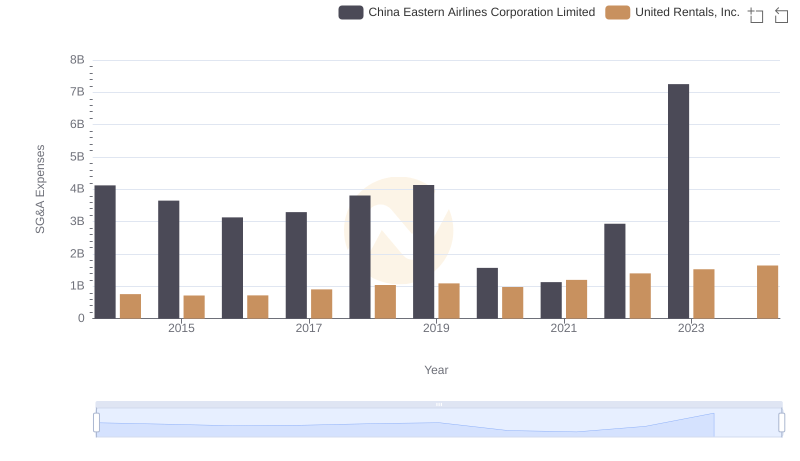
United Rentals, Inc. or China Eastern Airlines Corporation Limited: Who Manages SG&A Costs Better?
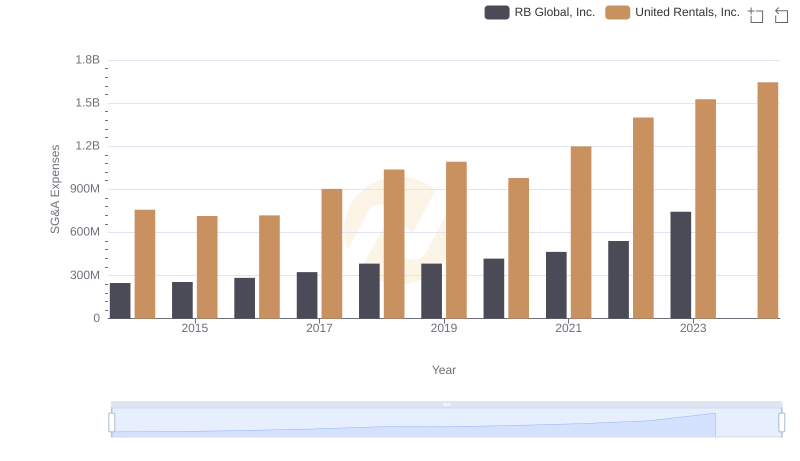
United Rentals, Inc. and RB Global, Inc.: SG&A Spending Patterns Compared

Breaking Down SG&A Expenses: United Rentals, Inc. vs Expeditors International of Washington, Inc.
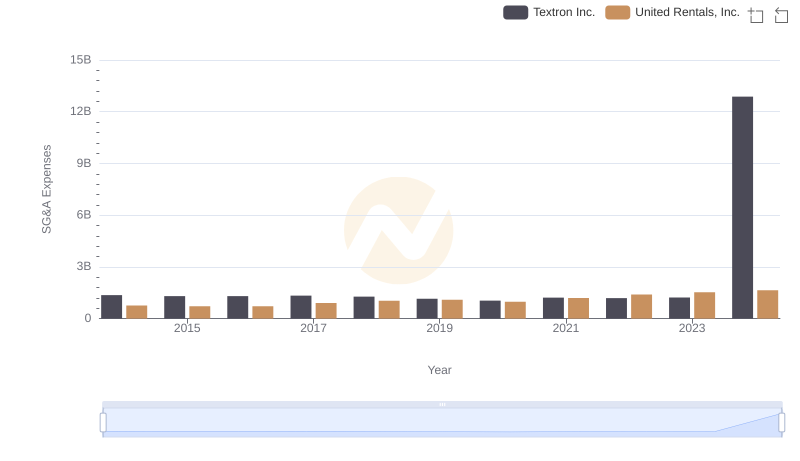
Comparing SG&A Expenses: United Rentals, Inc. vs Textron Inc. Trends and Insights
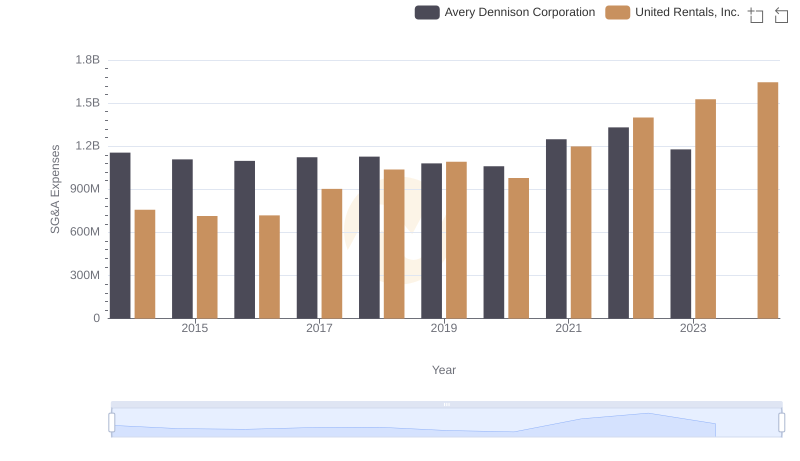
United Rentals, Inc. or Avery Dennison Corporation: Who Manages SG&A Costs Better?
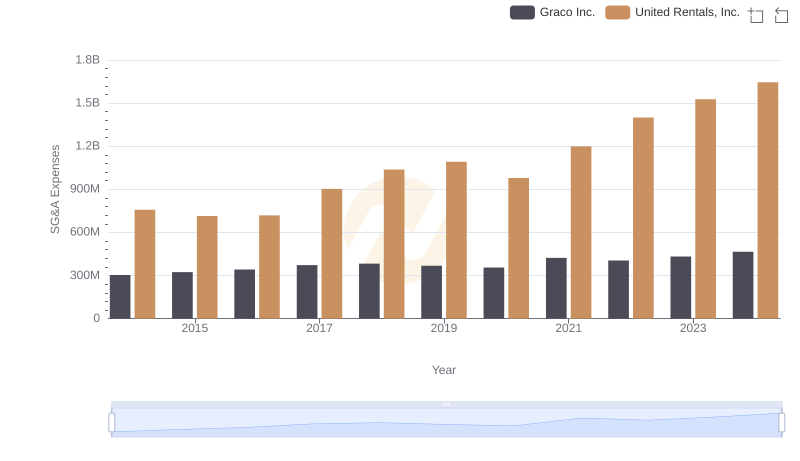
SG&A Efficiency Analysis: Comparing United Rentals, Inc. and Graco Inc.
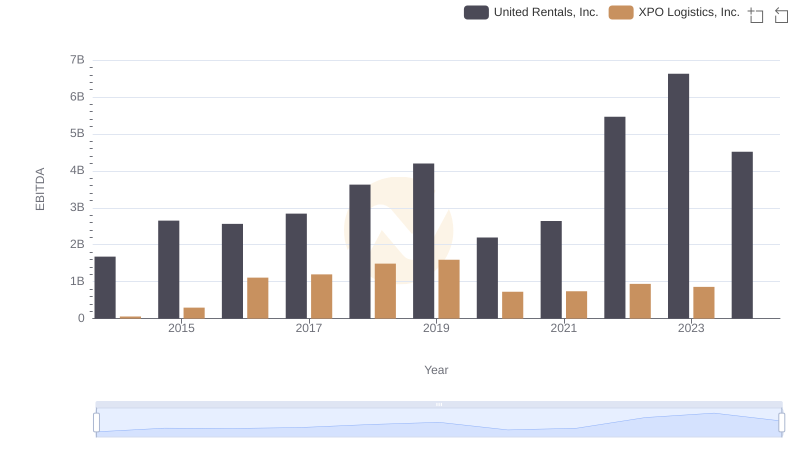
EBITDA Performance Review: United Rentals, Inc. vs XPO Logistics, Inc.