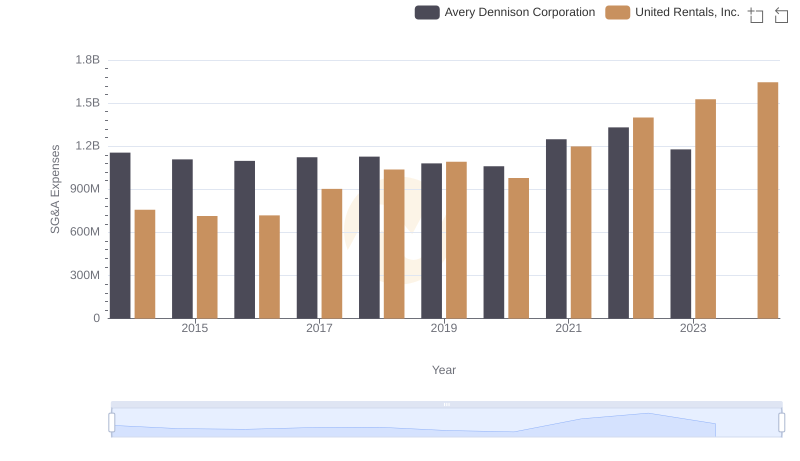
| __timestamp | Textron Inc. | United Rentals, Inc. |
|---|---|---|
| Wednesday, January 1, 2014 | 1361000000 | 758000000 |
| Thursday, January 1, 2015 | 1304000000 | 714000000 |
| Friday, January 1, 2016 | 1304000000 | 719000000 |
| Sunday, January 1, 2017 | 1337000000 | 903000000 |
| Monday, January 1, 2018 | 1275000000 | 1038000000 |
| Tuesday, January 1, 2019 | 1152000000 | 1092000000 |
| Wednesday, January 1, 2020 | 1045000000 | 979000000 |
| Friday, January 1, 2021 | 1221000000 | 1199000000 |
| Saturday, January 1, 2022 | 1186000000 | 1400000000 |
| Sunday, January 1, 2023 | 1225000000 | 1527000000 |
| Monday, January 1, 2024 | 1156000000 | 1645000000 |
Cracking the code
In the competitive landscape of industrial services, understanding the financial strategies of key players is crucial. Over the past decade, United Rentals, Inc. and Textron Inc. have showcased distinct trends in their Selling, General, and Administrative (SG&A) expenses. From 2014 to 2023, Textron Inc. maintained a relatively stable SG&A expense, averaging around $1.2 billion annually, with a notable spike in 2024. In contrast, United Rentals, Inc. demonstrated a steady increase, peaking at $1.5 billion in 2023, marking a 113% rise from 2014. This divergence highlights Textron's consistent cost management versus United Rentals' aggressive expansion strategy. Such insights are invaluable for investors and analysts seeking to understand the financial health and strategic direction of these industry leaders.
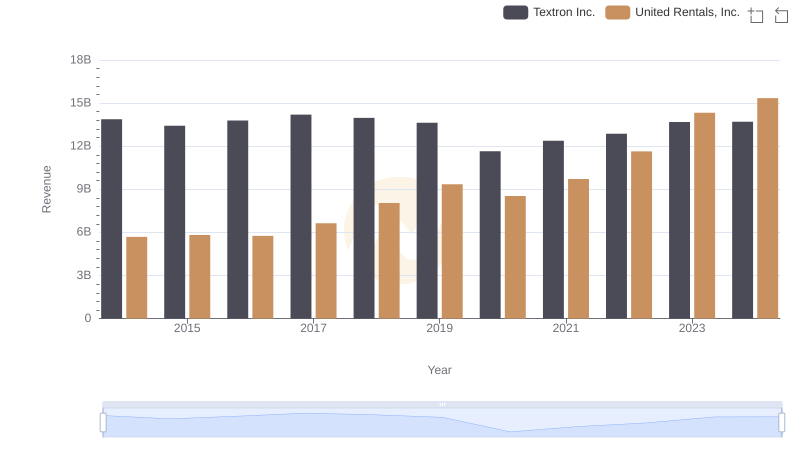
Revenue Insights: United Rentals, Inc. and Textron Inc. Performance Compared
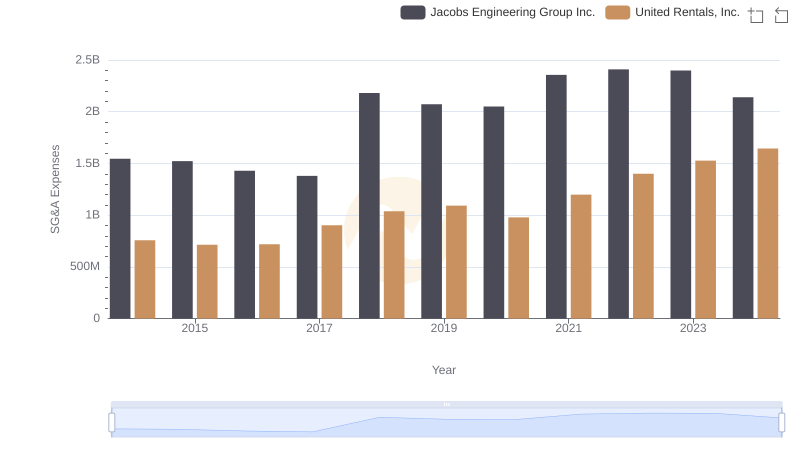
Who Optimizes SG&A Costs Better? United Rentals, Inc. or Jacobs Engineering Group Inc.
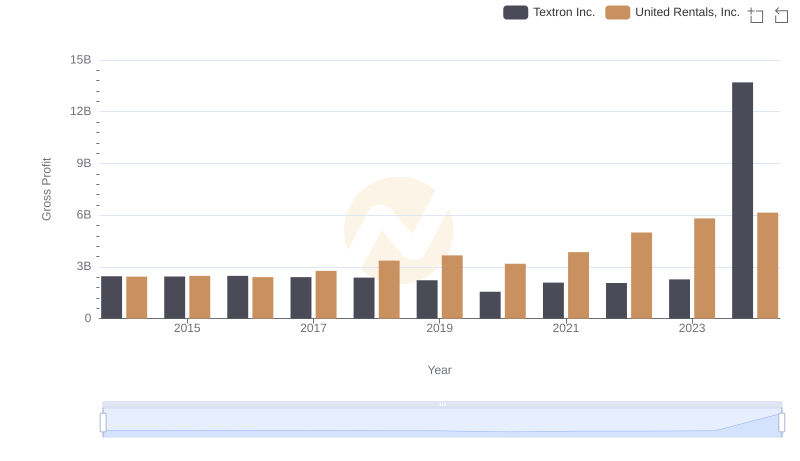
United Rentals, Inc. vs Textron Inc.: A Gross Profit Performance Breakdown
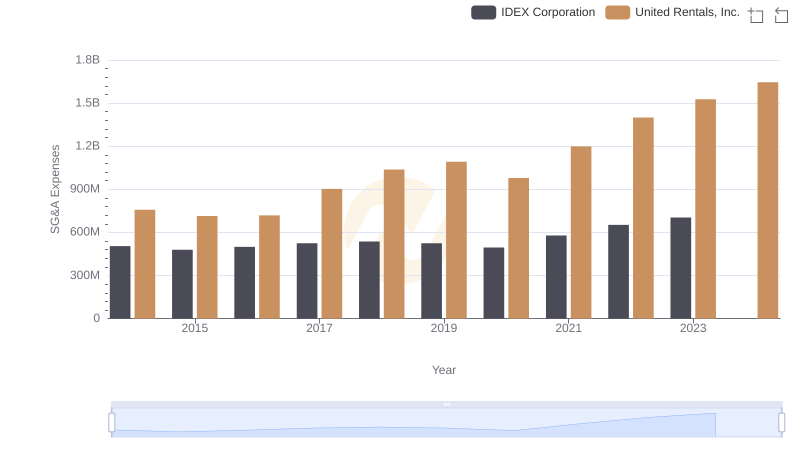
United Rentals, Inc. and IDEX Corporation: SG&A Spending Patterns Compared
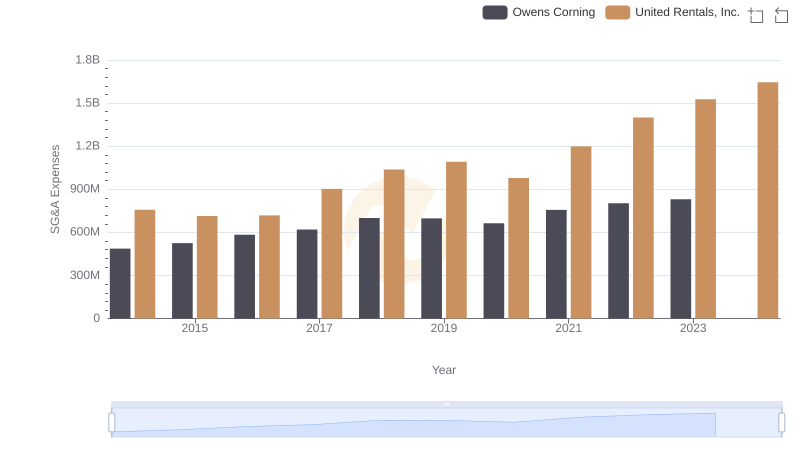
Breaking Down SG&A Expenses: United Rentals, Inc. vs Owens Corning
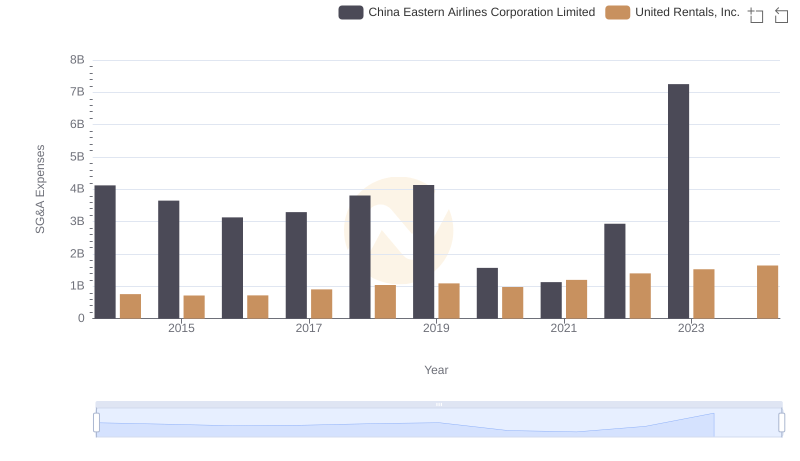
United Rentals, Inc. or China Eastern Airlines Corporation Limited: Who Manages SG&A Costs Better?
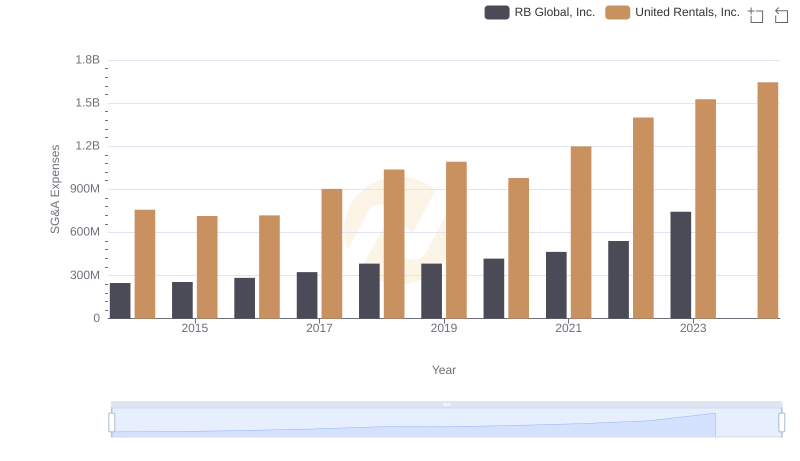
United Rentals, Inc. and RB Global, Inc.: SG&A Spending Patterns Compared

Breaking Down SG&A Expenses: United Rentals, Inc. vs Expeditors International of Washington, Inc.
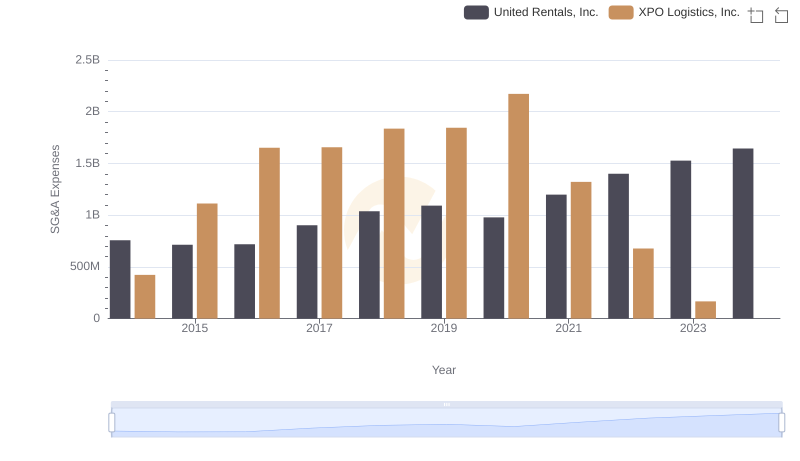
Operational Costs Compared: SG&A Analysis of United Rentals, Inc. and XPO Logistics, Inc.
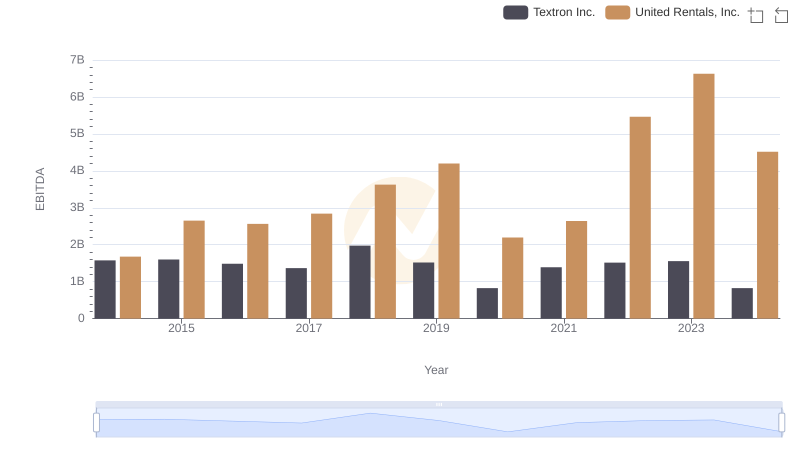
United Rentals, Inc. vs Textron Inc.: In-Depth EBITDA Performance Comparison
United Rentals, Inc. or Avery Dennison Corporation: Who Manages SG&A Costs Better?