| __timestamp | Trane Technologies plc | TransUnion |
|---|---|---|
| Wednesday, January 1, 2014 | 8982800000 | 499100000 |
| Thursday, January 1, 2015 | 9301600000 | 531600000 |
| Friday, January 1, 2016 | 9329300000 | 579100000 |
| Sunday, January 1, 2017 | 9811600000 | 645700000 |
| Monday, January 1, 2018 | 10847600000 | 790100000 |
| Tuesday, January 1, 2019 | 11451500000 | 874100000 |
| Wednesday, January 1, 2020 | 8651300000 | 920400000 |
| Friday, January 1, 2021 | 9666800000 | 991600000 |
| Saturday, January 1, 2022 | 11026900000 | 1222900000 |
| Sunday, January 1, 2023 | 11820400000 | 1517300000 |
| Monday, January 1, 2024 | 12757700000 | 0 |
In pursuit of knowledge
In the ever-evolving landscape of corporate finance, understanding cost structures is pivotal. Over the past decade, Trane Technologies plc and TransUnion have showcased contrasting trajectories in their cost of revenue. Trane Technologies, a leader in climate innovation, has consistently maintained a robust cost structure, with a notable increase of approximately 32% from 2014 to 2023. In contrast, TransUnion, a global information and insights company, has seen its cost of revenue triple over the same period, reflecting its aggressive expansion and adaptation strategies.
This comparison not only underscores the diverse strategies of these industry giants but also offers a glimpse into their future financial landscapes.
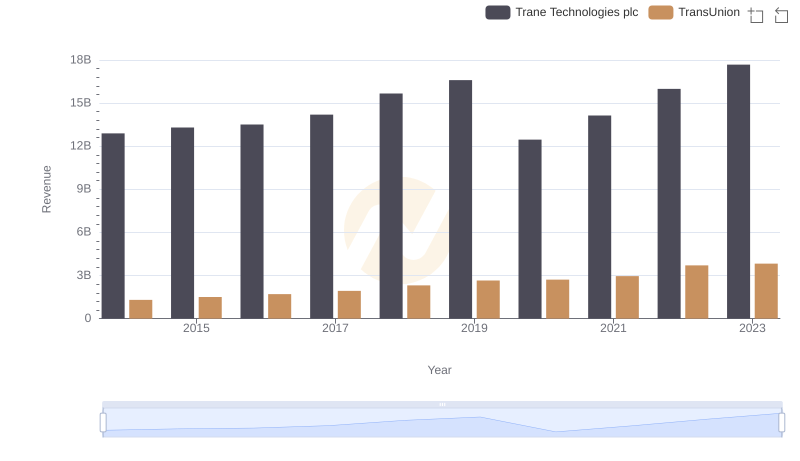
Revenue Insights: Trane Technologies plc and TransUnion Performance Compared
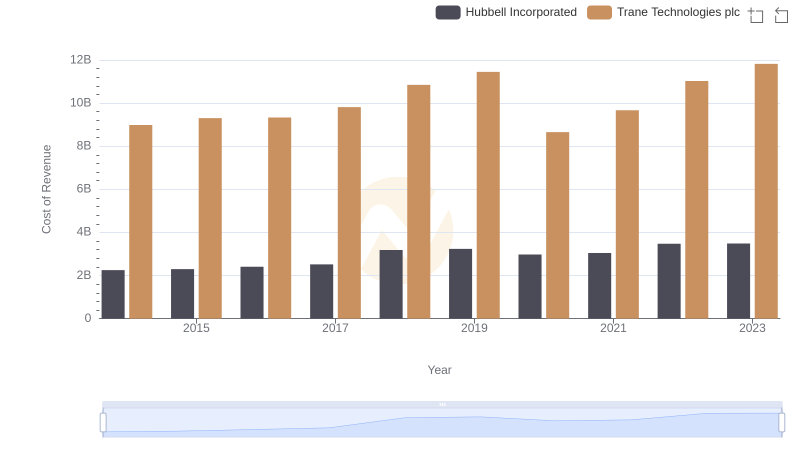
Analyzing Cost of Revenue: Trane Technologies plc and Hubbell Incorporated
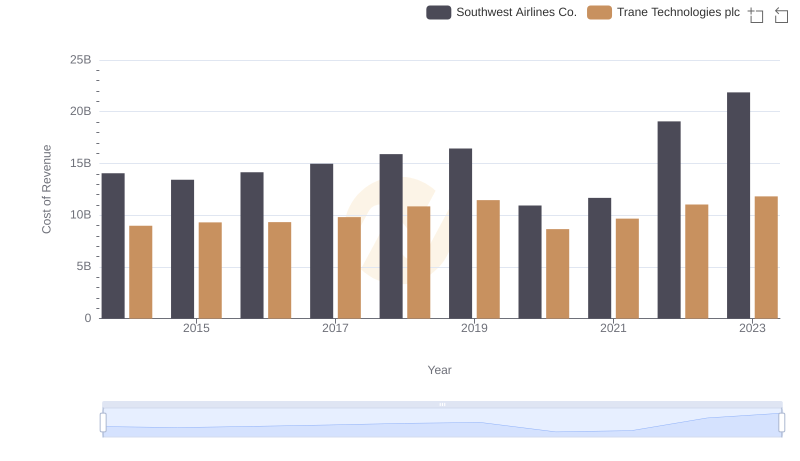
Analyzing Cost of Revenue: Trane Technologies plc and Southwest Airlines Co.
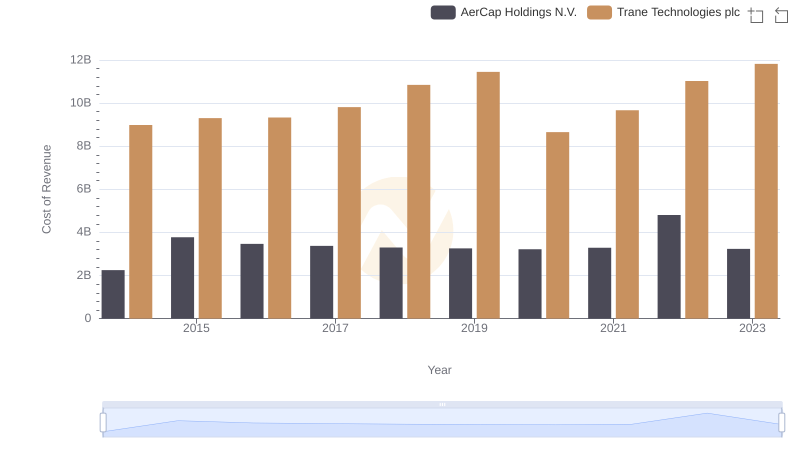
Trane Technologies plc vs AerCap Holdings N.V.: Efficiency in Cost of Revenue Explored
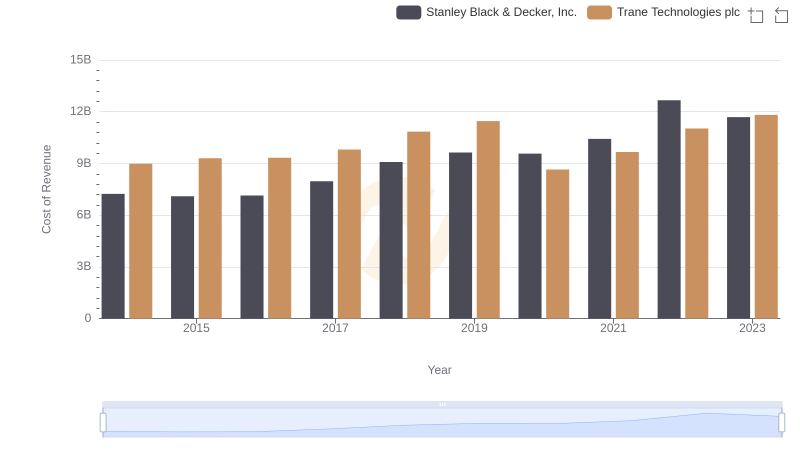
Cost of Revenue Trends: Trane Technologies plc vs Stanley Black & Decker, Inc.
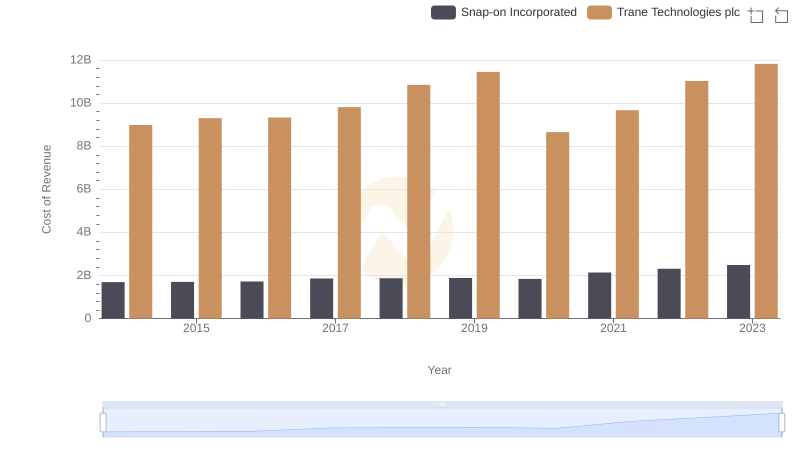
Cost Insights: Breaking Down Trane Technologies plc and Snap-on Incorporated's Expenses
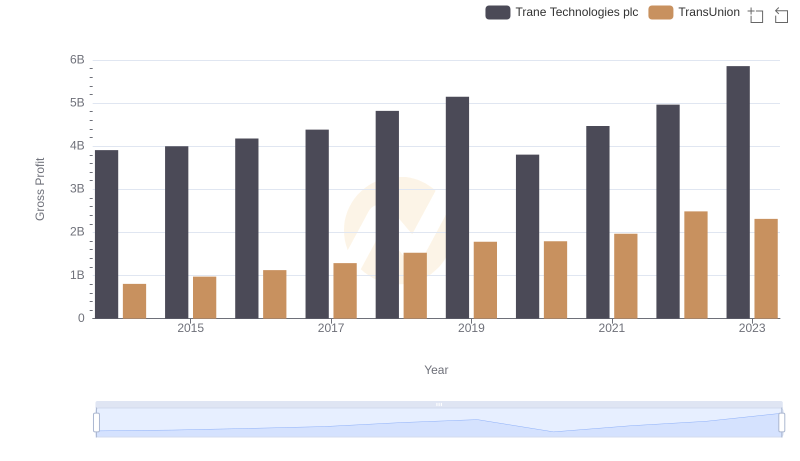
Who Generates Higher Gross Profit? Trane Technologies plc or TransUnion
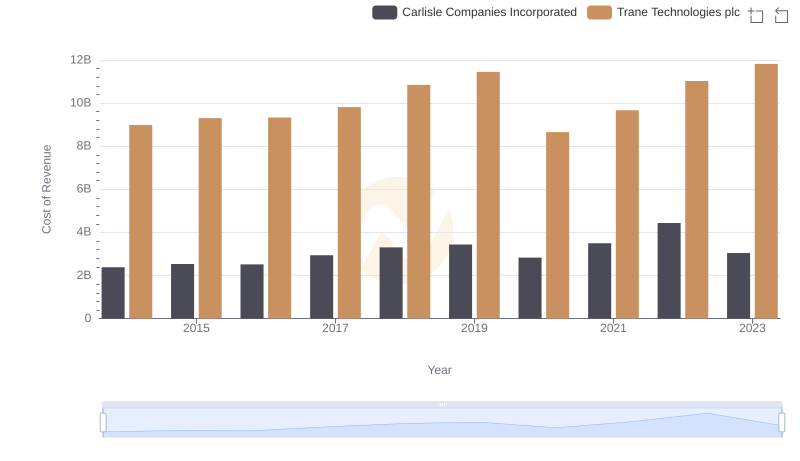
Comparing Cost of Revenue Efficiency: Trane Technologies plc vs Carlisle Companies Incorporated
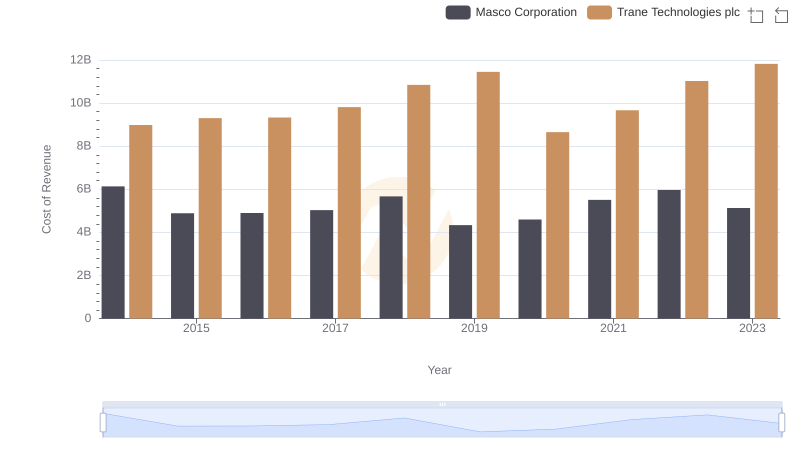
Cost of Revenue Trends: Trane Technologies plc vs Masco Corporation
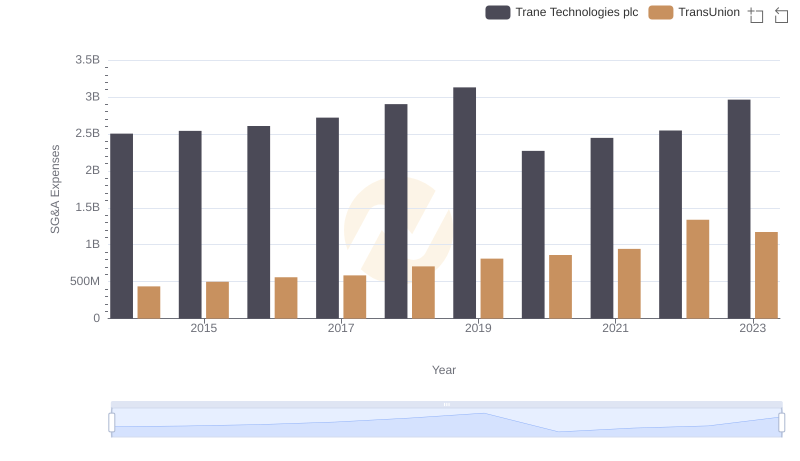
Breaking Down SG&A Expenses: Trane Technologies plc vs TransUnion

Trane Technologies plc vs TransUnion: In-Depth EBITDA Performance Comparison