| __timestamp | J.B. Hunt Transport Services, Inc. | Trane Technologies plc |
|---|---|---|
| Wednesday, January 1, 2014 | 926038000 | 1757000000 |
| Thursday, January 1, 2015 | 1055307000 | 1835000000 |
| Friday, January 1, 2016 | 1082601000 | 2311000000 |
| Sunday, January 1, 2017 | 1007307000 | 1982500000 |
| Monday, January 1, 2018 | 1116914000 | 2242400000 |
| Tuesday, January 1, 2019 | 1274241000 | 1931200000 |
| Wednesday, January 1, 2020 | 713119000 | 1831900000 |
| Friday, January 1, 2021 | 1045530000 | 2319200000 |
| Saturday, January 1, 2022 | 1331553000 | 2715500000 |
| Sunday, January 1, 2023 | 1738774000 | 3149900000 |
| Monday, January 1, 2024 | 3859600000 |
Unleashing the power of data
In the ever-evolving landscape of American industry, Trane Technologies plc and J.B. Hunt Transport Services, Inc. stand as paragons of resilience and growth. Over the past decade, these giants have showcased remarkable EBITDA growth, a key indicator of financial health. From 2014 to 2023, Trane Technologies has consistently outperformed, with a staggering 79% increase in EBITDA, peaking at approximately $3.15 billion in 2023. Meanwhile, J.B. Hunt has demonstrated a robust 88% growth, reaching around $1.74 billion in the same year.
These insights highlight the dynamic nature of these industries and their pivotal roles in shaping the future.
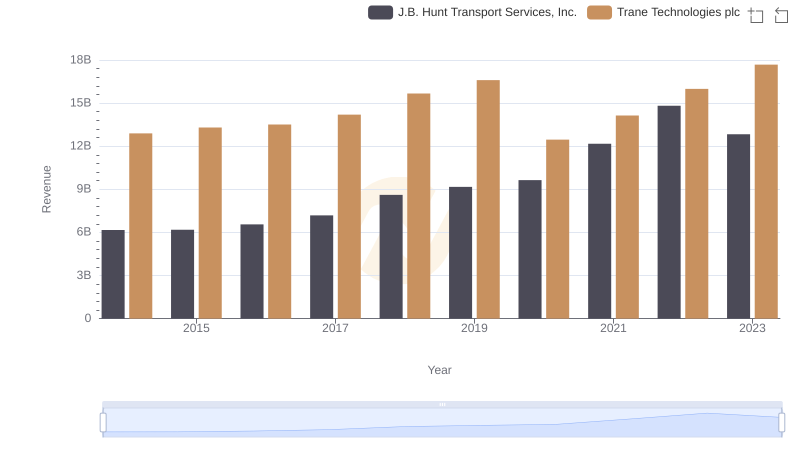
Trane Technologies plc vs J.B. Hunt Transport Services, Inc.: Examining Key Revenue Metrics
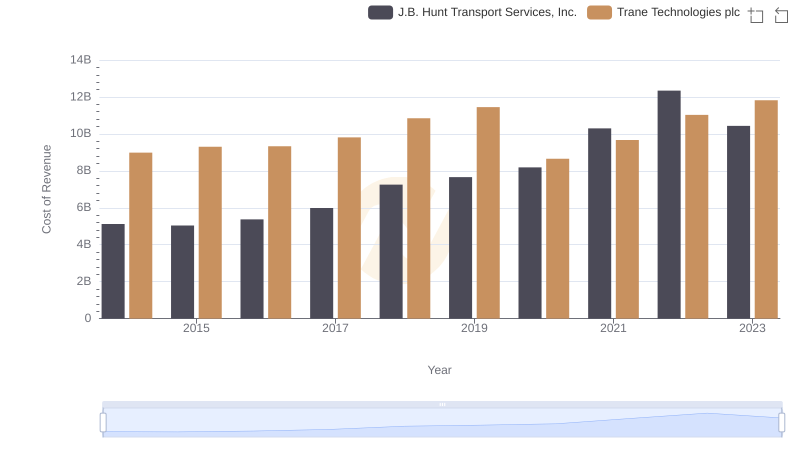
Trane Technologies plc vs J.B. Hunt Transport Services, Inc.: Efficiency in Cost of Revenue Explored
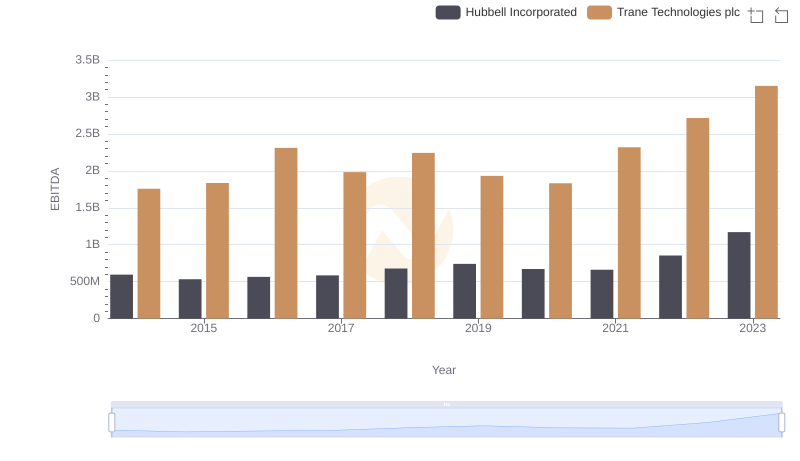
Trane Technologies plc and Hubbell Incorporated: A Detailed Examination of EBITDA Performance
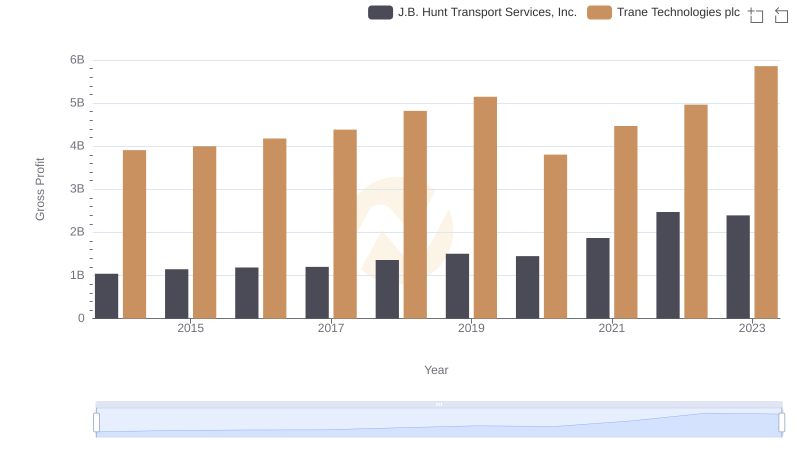
Gross Profit Comparison: Trane Technologies plc and J.B. Hunt Transport Services, Inc. Trends
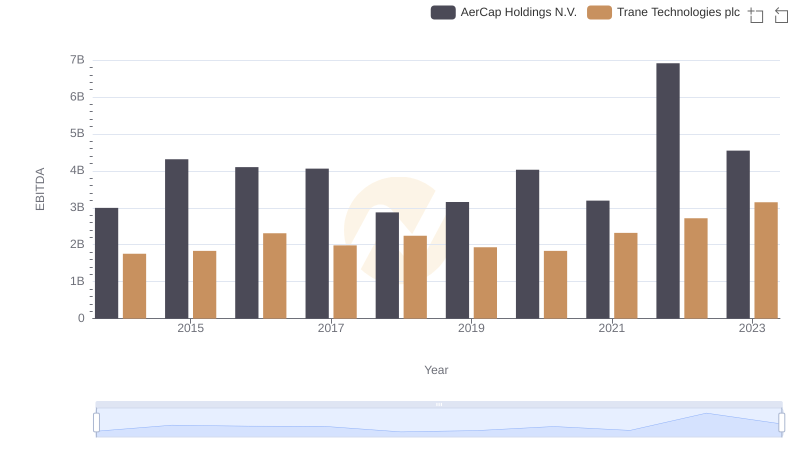
Comprehensive EBITDA Comparison: Trane Technologies plc vs AerCap Holdings N.V.

Trane Technologies plc vs TransUnion: In-Depth EBITDA Performance Comparison
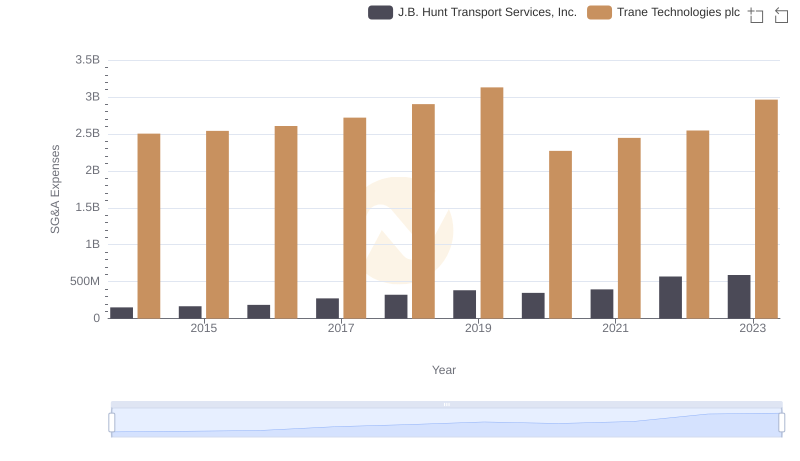
Trane Technologies plc or J.B. Hunt Transport Services, Inc.: Who Manages SG&A Costs Better?
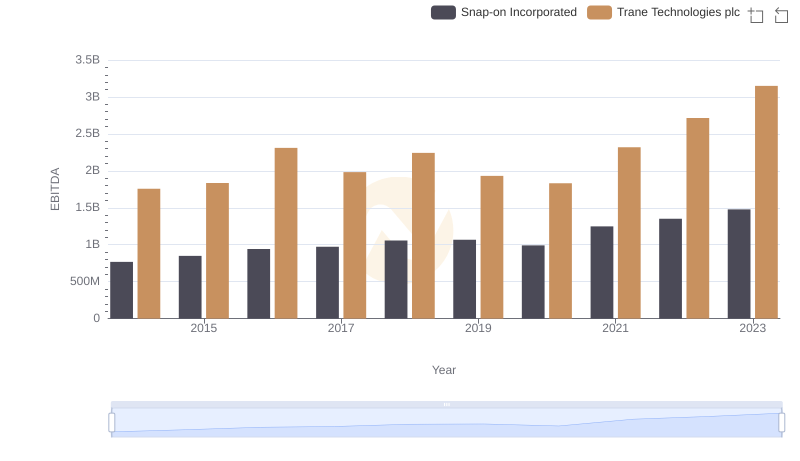
A Professional Review of EBITDA: Trane Technologies plc Compared to Snap-on Incorporated
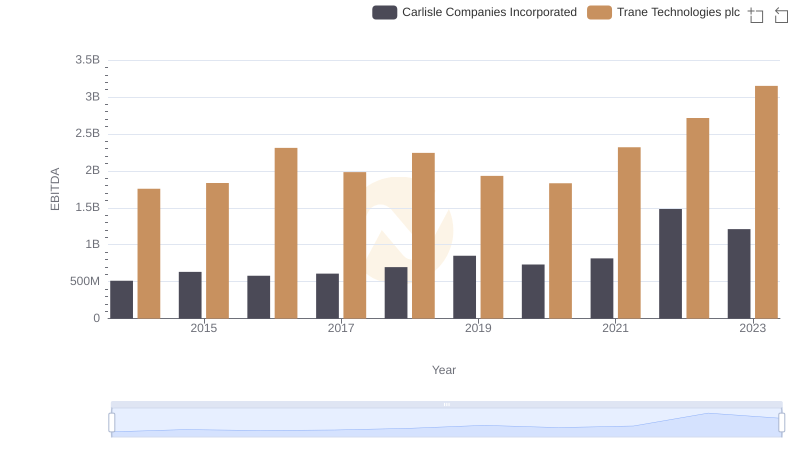
A Professional Review of EBITDA: Trane Technologies plc Compared to Carlisle Companies Incorporated
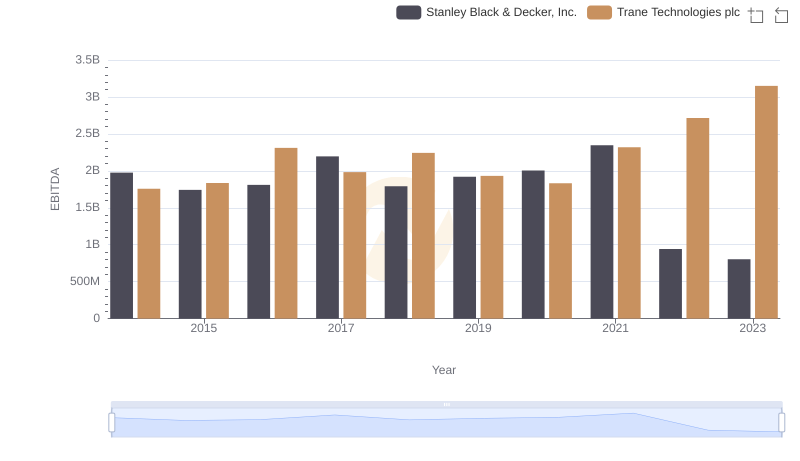
EBITDA Metrics Evaluated: Trane Technologies plc vs Stanley Black & Decker, Inc.

Professional EBITDA Benchmarking: Trane Technologies plc vs Booz Allen Hamilton Holding Corporation