| __timestamp | AerCap Holdings N.V. | Watsco, Inc. |
|---|---|---|
| Wednesday, January 1, 2014 | 299900000 | 650655000 |
| Thursday, January 1, 2015 | 381308000 | 670609000 |
| Friday, January 1, 2016 | 351012000 | 688952000 |
| Sunday, January 1, 2017 | 348291000 | 715671000 |
| Monday, January 1, 2018 | 305226000 | 757452000 |
| Tuesday, January 1, 2019 | 267458000 | 800328000 |
| Wednesday, January 1, 2020 | 242161000 | 833051000 |
| Friday, January 1, 2021 | 317888000 | 1058316000 |
| Saturday, January 1, 2022 | 399530000 | 1221382000 |
| Sunday, January 1, 2023 | 464128000 | 1185626000 |
| Monday, January 1, 2024 | 1262938000 |
Unleashing insights
In the world of corporate finance, Selling, General, and Administrative (SG&A) expenses are a crucial indicator of a company's operational efficiency. This analysis compares the SG&A expenses of Watsco, Inc. and AerCap Holdings N.V. from 2014 to 2023. Over this period, Watsco, Inc. consistently outpaced AerCap Holdings N.V. in SG&A spending, with an average annual expense nearly 2.5 times higher. Notably, Watsco's expenses surged by approximately 82% from 2014 to 2023, peaking in 2022. In contrast, AerCap's expenses showed a more modest increase of about 55% over the same period, with a significant jump in 2023. This divergence highlights differing strategic priorities and operational scales between the two companies. As businesses navigate economic fluctuations, understanding these expense trends can offer valuable insights into their financial health and strategic direction.
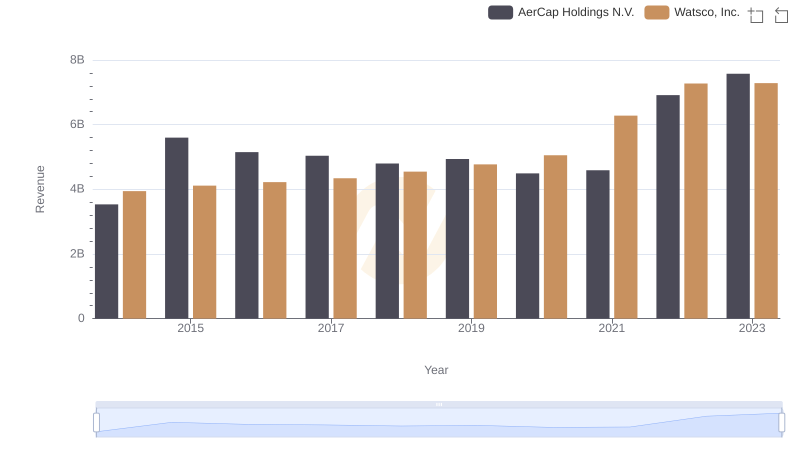
Watsco, Inc. vs AerCap Holdings N.V.: Examining Key Revenue Metrics
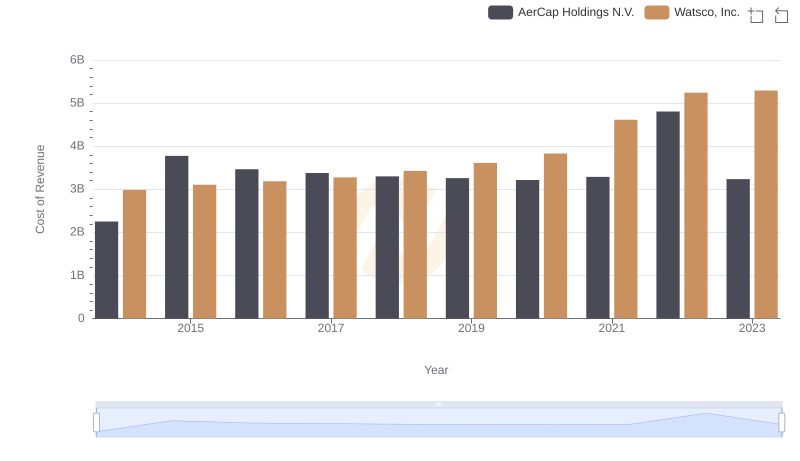
Cost of Revenue Comparison: Watsco, Inc. vs AerCap Holdings N.V.
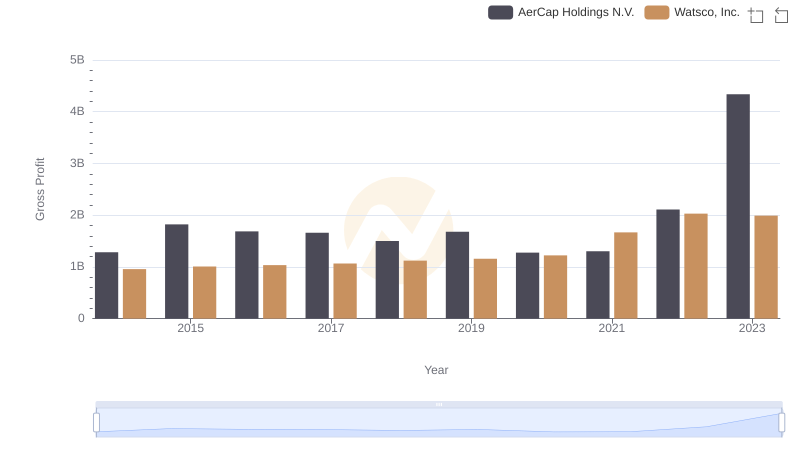
Gross Profit Comparison: Watsco, Inc. and AerCap Holdings N.V. Trends
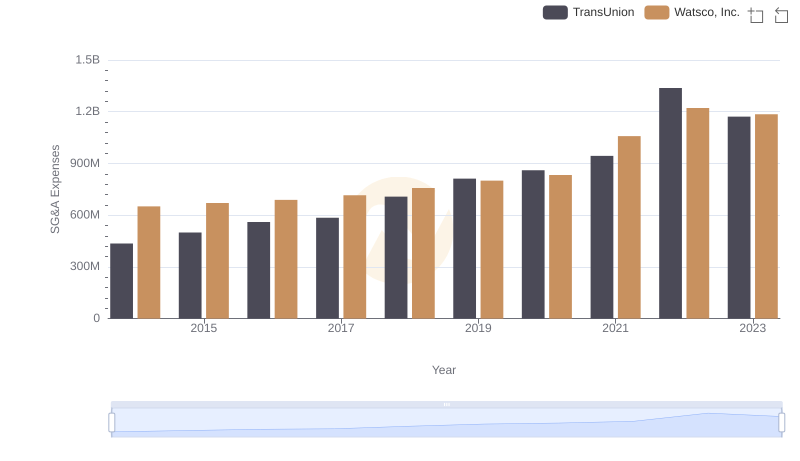
Breaking Down SG&A Expenses: Watsco, Inc. vs TransUnion
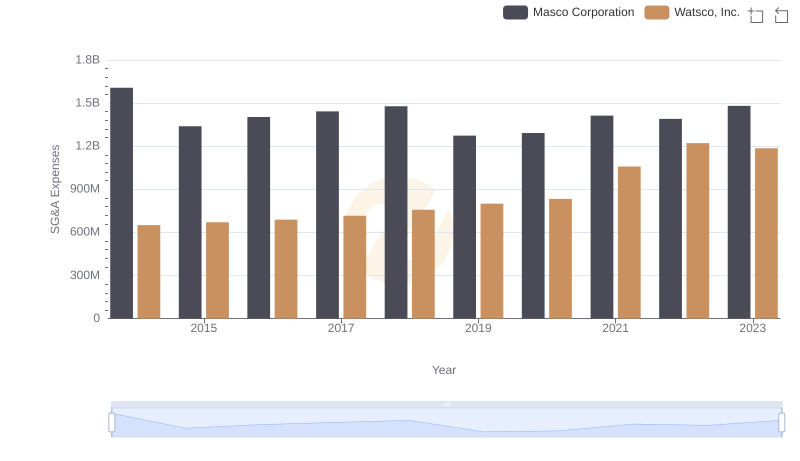
SG&A Efficiency Analysis: Comparing Watsco, Inc. and Masco Corporation
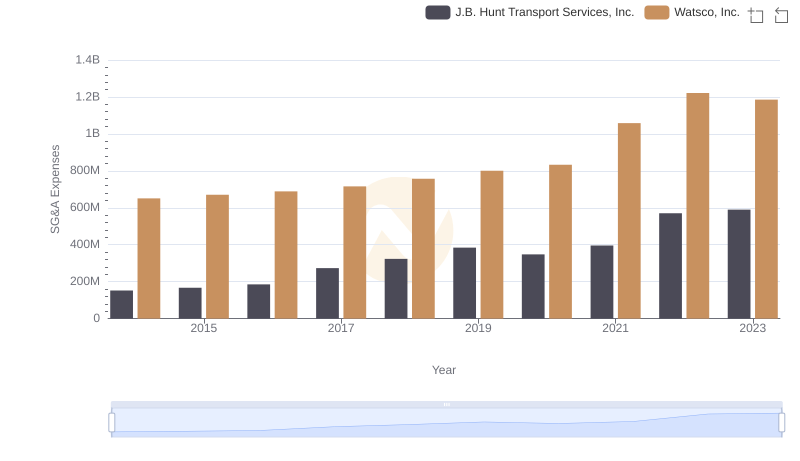
Operational Costs Compared: SG&A Analysis of Watsco, Inc. and J.B. Hunt Transport Services, Inc.
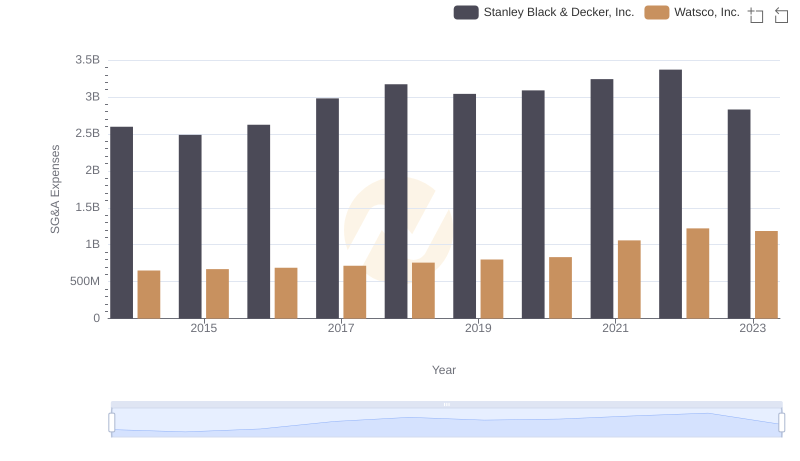
Breaking Down SG&A Expenses: Watsco, Inc. vs Stanley Black & Decker, Inc.
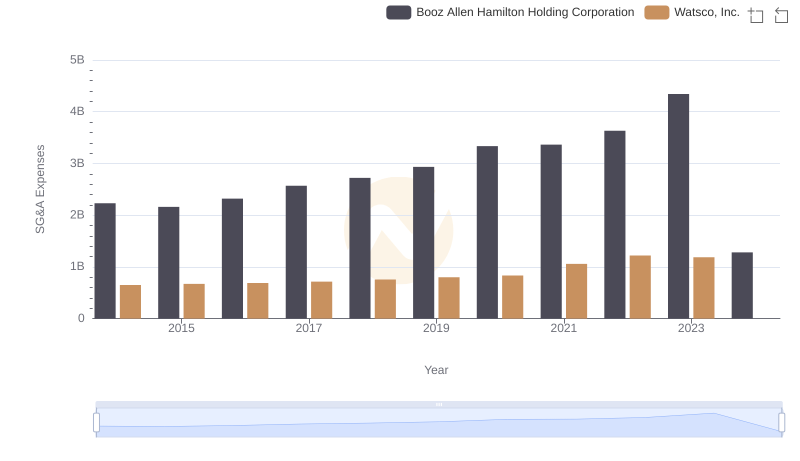
Comparing SG&A Expenses: Watsco, Inc. vs Booz Allen Hamilton Holding Corporation Trends and Insights
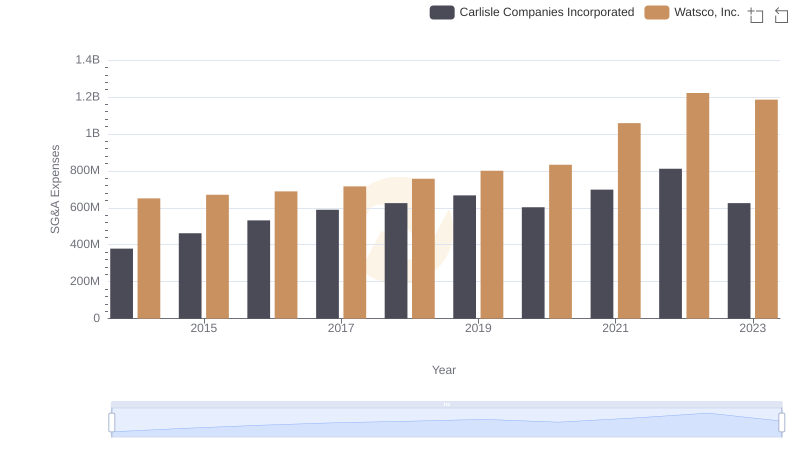
Watsco, Inc. and Carlisle Companies Incorporated: SG&A Spending Patterns Compared