| __timestamp | Carlisle Companies Incorporated | Watsco, Inc. |
|---|---|---|
| Wednesday, January 1, 2014 | 379000000 | 650655000 |
| Thursday, January 1, 2015 | 461900000 | 670609000 |
| Friday, January 1, 2016 | 532000000 | 688952000 |
| Sunday, January 1, 2017 | 589400000 | 715671000 |
| Monday, January 1, 2018 | 625400000 | 757452000 |
| Tuesday, January 1, 2019 | 667100000 | 800328000 |
| Wednesday, January 1, 2020 | 603200000 | 833051000 |
| Friday, January 1, 2021 | 698200000 | 1058316000 |
| Saturday, January 1, 2022 | 811500000 | 1221382000 |
| Sunday, January 1, 2023 | 625200000 | 1185626000 |
| Monday, January 1, 2024 | 722800000 | 1262938000 |
Data in motion
In the competitive landscape of industrial and commercial sectors, understanding the financial strategies of leading companies is crucial. Over the past decade, Watsco, Inc. and Carlisle Companies Incorporated have demonstrated distinct approaches to managing their Selling, General, and Administrative (SG&A) expenses.
From 2014 to 2023, Watsco, Inc. consistently outpaced Carlisle Companies in SG&A spending, with an average annual increase of approximately 8%. By 2022, Watsco's SG&A expenses had surged by nearly 88% from 2014 levels, peaking at over $1.2 billion. In contrast, Carlisle Companies exhibited a more conservative growth trajectory, with a 53% increase over the same period, reaching a high of $811 million in 2022.
These spending patterns reflect differing strategic priorities. Watsco's aggressive investment in administrative functions may indicate a focus on expansion and market penetration, while Carlisle's steadier approach suggests a focus on efficiency and cost management.
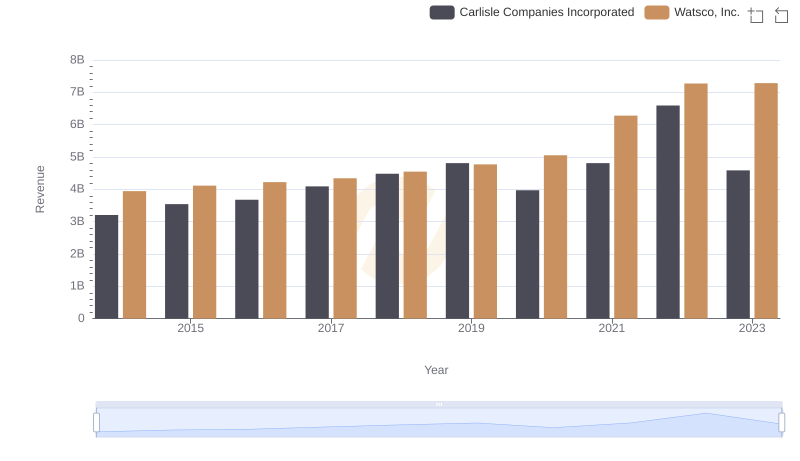
Annual Revenue Comparison: Watsco, Inc. vs Carlisle Companies Incorporated
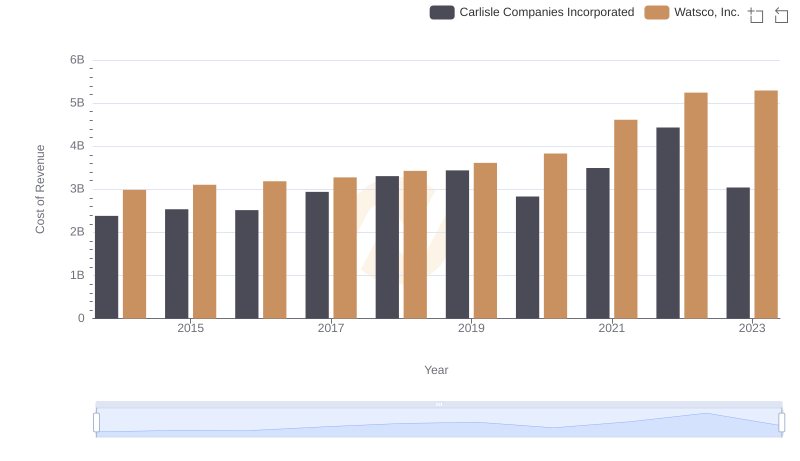
Cost Insights: Breaking Down Watsco, Inc. and Carlisle Companies Incorporated's Expenses
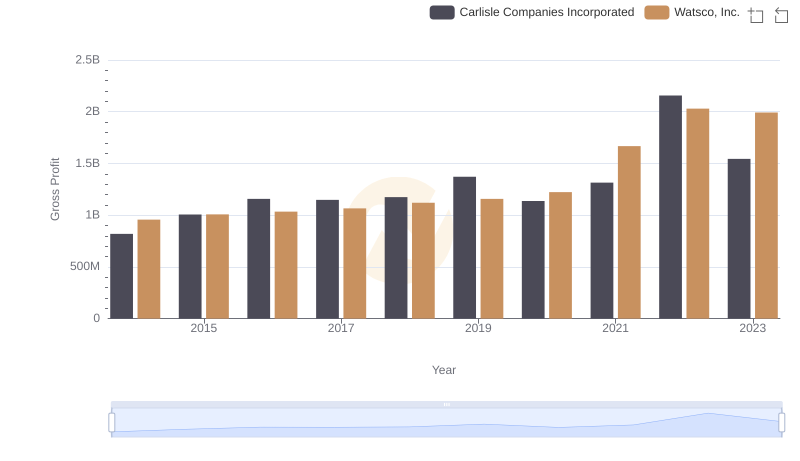
Key Insights on Gross Profit: Watsco, Inc. vs Carlisle Companies Incorporated
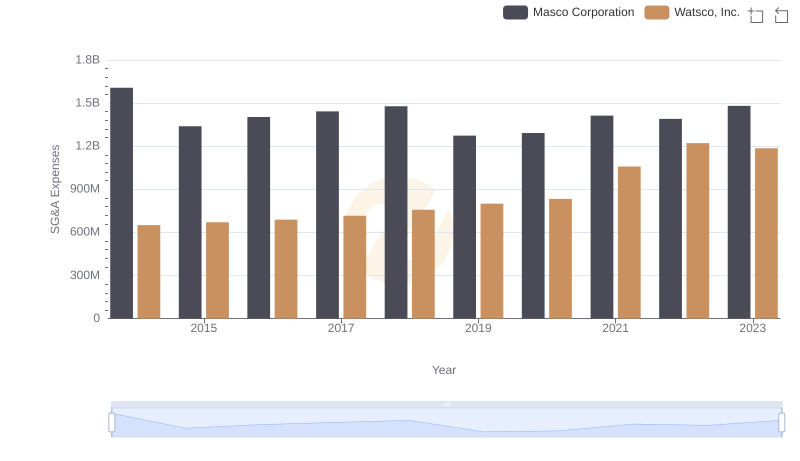
SG&A Efficiency Analysis: Comparing Watsco, Inc. and Masco Corporation
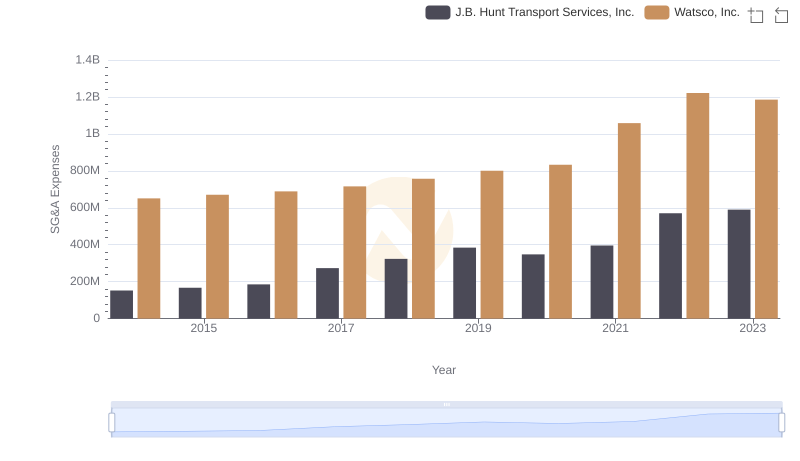
Operational Costs Compared: SG&A Analysis of Watsco, Inc. and J.B. Hunt Transport Services, Inc.
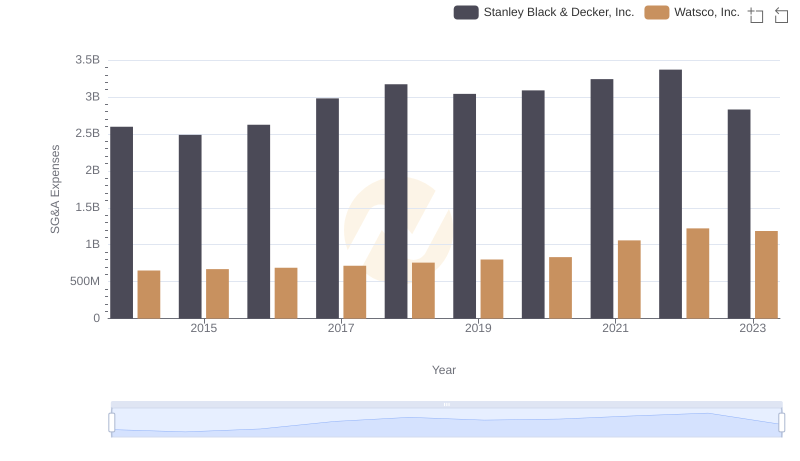
Breaking Down SG&A Expenses: Watsco, Inc. vs Stanley Black & Decker, Inc.
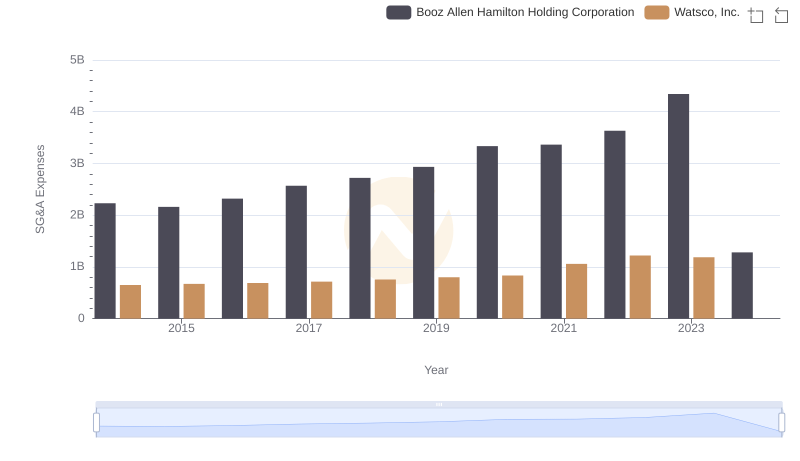
Comparing SG&A Expenses: Watsco, Inc. vs Booz Allen Hamilton Holding Corporation Trends and Insights
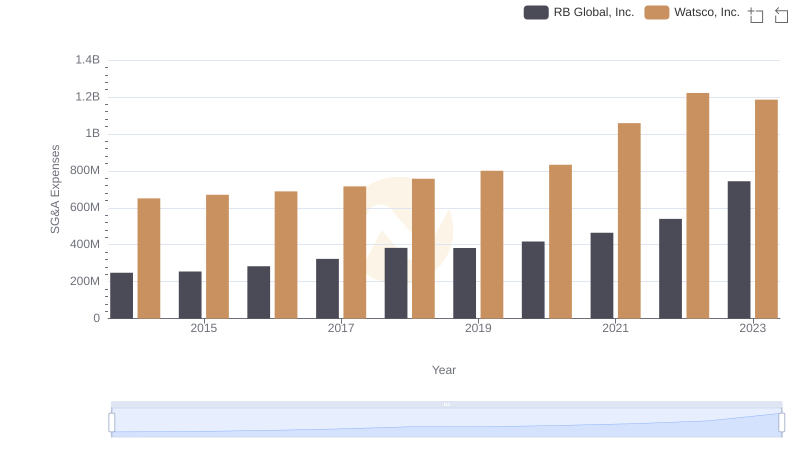
Selling, General, and Administrative Costs: Watsco, Inc. vs RB Global, Inc.
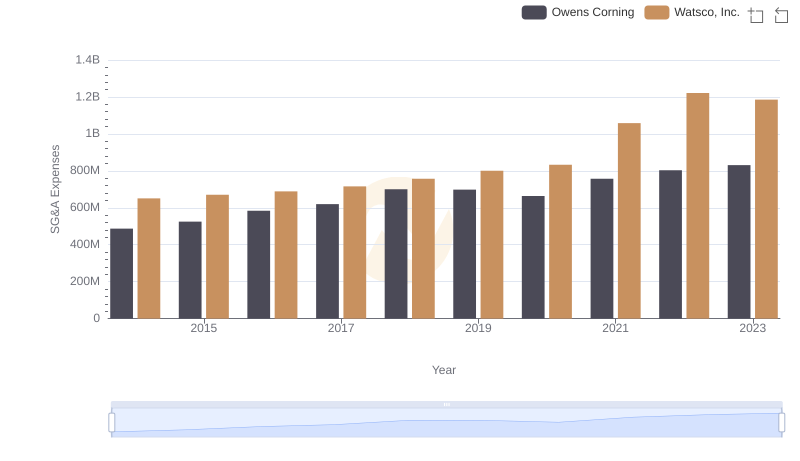
Selling, General, and Administrative Costs: Watsco, Inc. vs Owens Corning
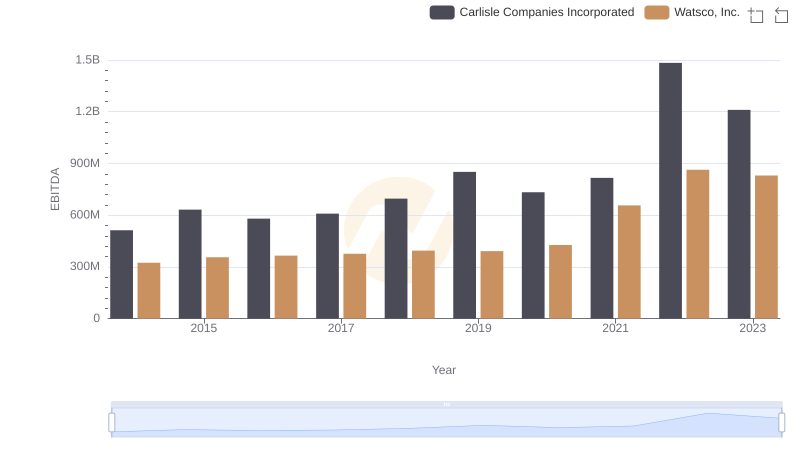
Watsco, Inc. and Carlisle Companies Incorporated: A Detailed Examination of EBITDA Performance