| __timestamp | J.B. Hunt Transport Services, Inc. | Watsco, Inc. |
|---|---|---|
| Wednesday, January 1, 2014 | 152469000 | 650655000 |
| Thursday, January 1, 2015 | 166799000 | 670609000 |
| Friday, January 1, 2016 | 185436000 | 688952000 |
| Sunday, January 1, 2017 | 273440000 | 715671000 |
| Monday, January 1, 2018 | 323587000 | 757452000 |
| Tuesday, January 1, 2019 | 383981000 | 800328000 |
| Wednesday, January 1, 2020 | 348076000 | 833051000 |
| Friday, January 1, 2021 | 395533000 | 1058316000 |
| Saturday, January 1, 2022 | 570191000 | 1221382000 |
| Sunday, January 1, 2023 | 590242000 | 1185626000 |
| Monday, January 1, 2024 | 1262938000 |
Unveiling the hidden dimensions of data
In the ever-evolving landscape of corporate finance, understanding operational costs is crucial for strategic decision-making. Over the past decade, Watsco, Inc. and J.B. Hunt Transport Services, Inc. have demonstrated distinct trends in their Selling, General, and Administrative (SG&A) expenses. From 2014 to 2023, Watsco, Inc. consistently reported higher SG&A expenses, peaking in 2022 with a 22% increase from 2014. Meanwhile, J.B. Hunt Transport Services, Inc. saw a significant rise, with expenses nearly quadrupling by 2023. This upward trajectory highlights the growing operational demands and strategic investments in these industries. As companies navigate the complexities of modern business, analyzing such financial metrics provides invaluable insights into their operational efficiency and market positioning.
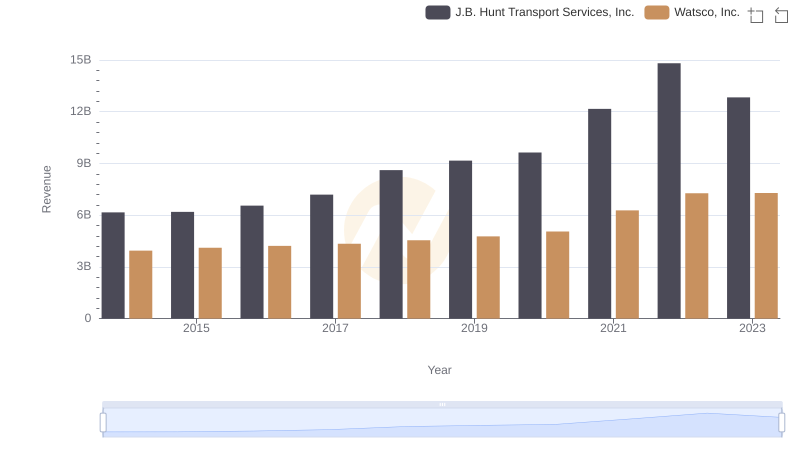
Watsco, Inc. vs J.B. Hunt Transport Services, Inc.: Annual Revenue Growth Compared
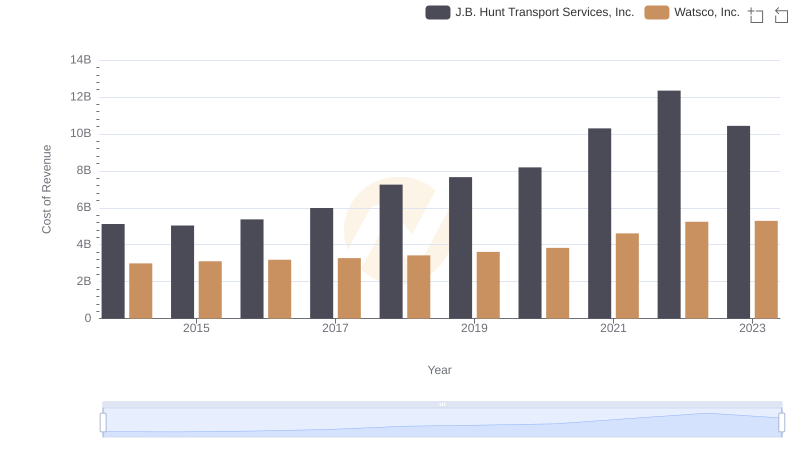
Cost Insights: Breaking Down Watsco, Inc. and J.B. Hunt Transport Services, Inc.'s Expenses
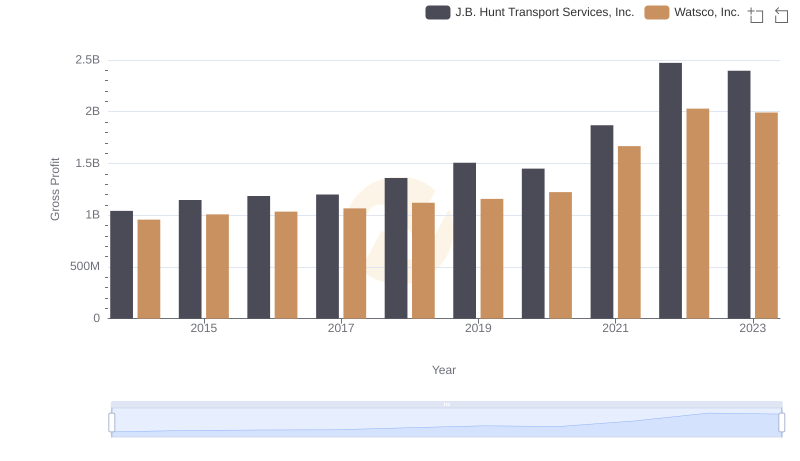
Key Insights on Gross Profit: Watsco, Inc. vs J.B. Hunt Transport Services, Inc.
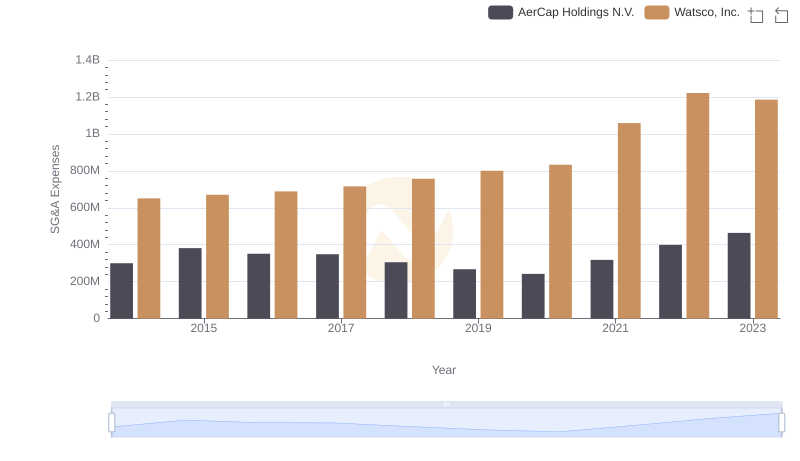
Breaking Down SG&A Expenses: Watsco, Inc. vs AerCap Holdings N.V.
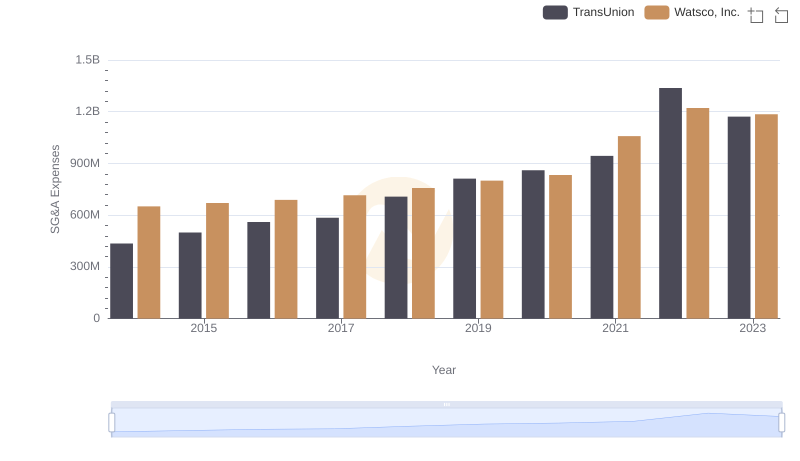
Breaking Down SG&A Expenses: Watsco, Inc. vs TransUnion
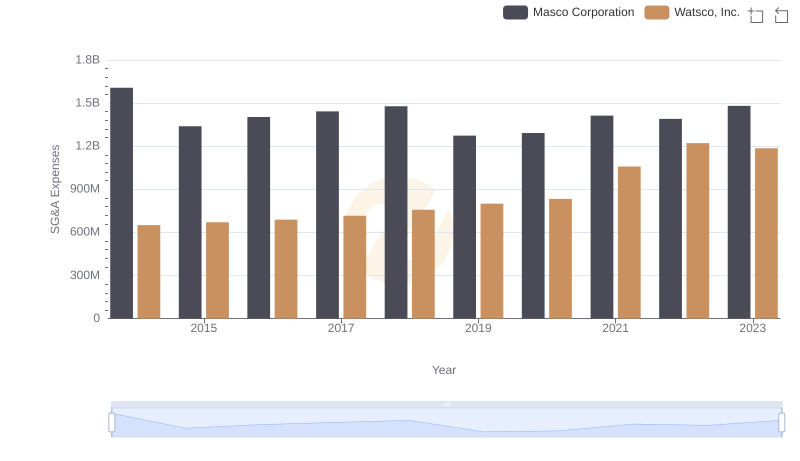
SG&A Efficiency Analysis: Comparing Watsco, Inc. and Masco Corporation
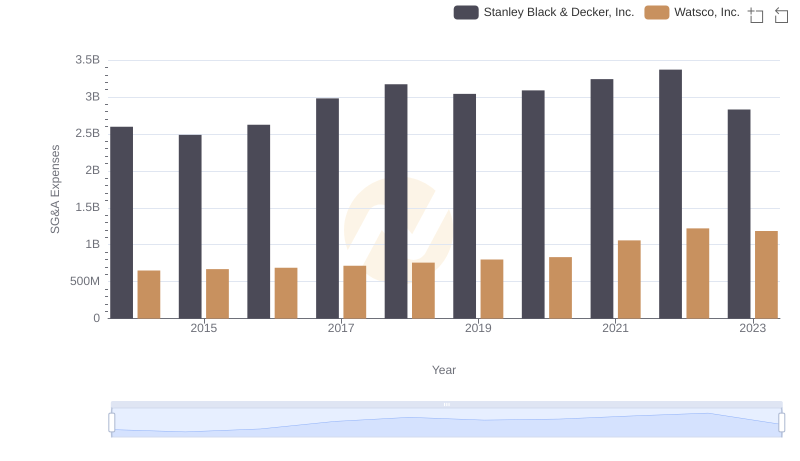
Breaking Down SG&A Expenses: Watsco, Inc. vs Stanley Black & Decker, Inc.
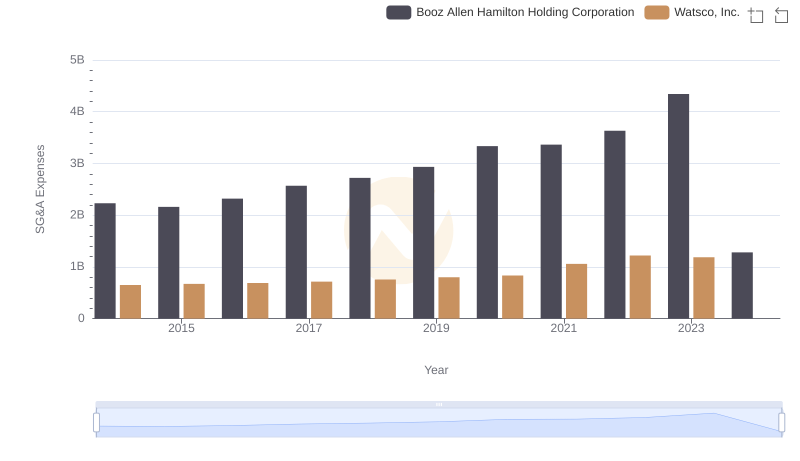
Comparing SG&A Expenses: Watsco, Inc. vs Booz Allen Hamilton Holding Corporation Trends and Insights
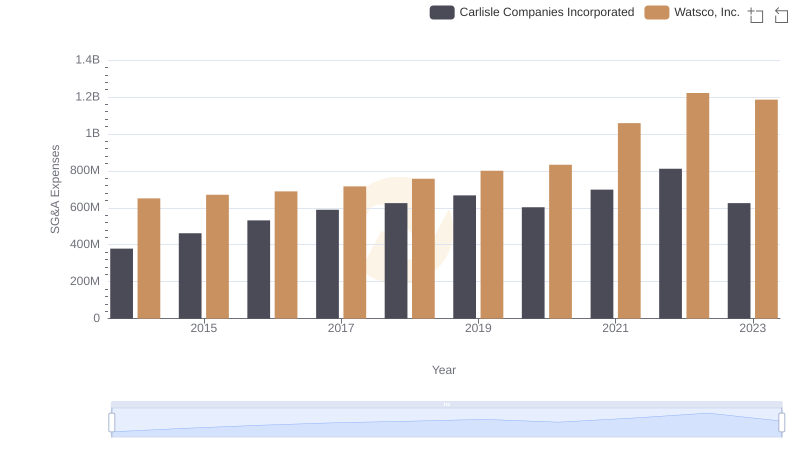
Watsco, Inc. and Carlisle Companies Incorporated: SG&A Spending Patterns Compared
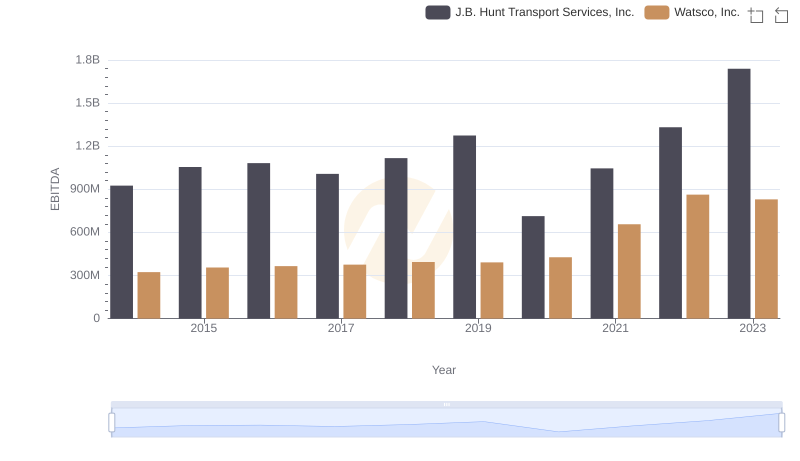
A Professional Review of EBITDA: Watsco, Inc. Compared to J.B. Hunt Transport Services, Inc.