| __timestamp | Stanley Black & Decker, Inc. | Watsco, Inc. |
|---|---|---|
| Wednesday, January 1, 2014 | 2595900000 | 650655000 |
| Thursday, January 1, 2015 | 2486400000 | 670609000 |
| Friday, January 1, 2016 | 2623900000 | 688952000 |
| Sunday, January 1, 2017 | 2980100000 | 715671000 |
| Monday, January 1, 2018 | 3171700000 | 757452000 |
| Tuesday, January 1, 2019 | 3041000000 | 800328000 |
| Wednesday, January 1, 2020 | 3089600000 | 833051000 |
| Friday, January 1, 2021 | 3240400000 | 1058316000 |
| Saturday, January 1, 2022 | 3370000000 | 1221382000 |
| Sunday, January 1, 2023 | 2829300000 | 1185626000 |
| Monday, January 1, 2024 | 3310500000 | 1262938000 |
Infusing magic into the data realm
In the world of corporate finance, Selling, General, and Administrative (SG&A) expenses are a critical measure of a company's operational efficiency. This chart provides a fascinating comparison between Watsco, Inc. and Stanley Black & Decker, Inc. from 2014 to 2023. Over this period, Stanley Black & Decker's SG&A expenses have shown a steady increase, peaking in 2022 with a 30% rise from 2014. However, 2023 saw a notable decline of approximately 16% from the previous year, indicating potential cost-cutting measures or strategic shifts.
Conversely, Watsco, Inc. has demonstrated a more consistent upward trend, with expenses nearly doubling over the decade. This growth reflects Watsco's expanding operations and market presence. The data highlights the contrasting financial strategies of these two industry leaders, offering valuable insights into their operational priorities and market dynamics.
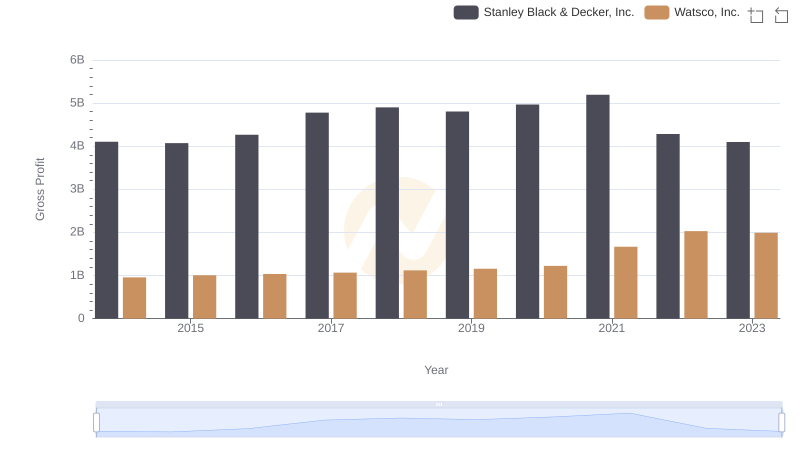
Key Insights on Gross Profit: Watsco, Inc. vs Stanley Black & Decker, Inc.
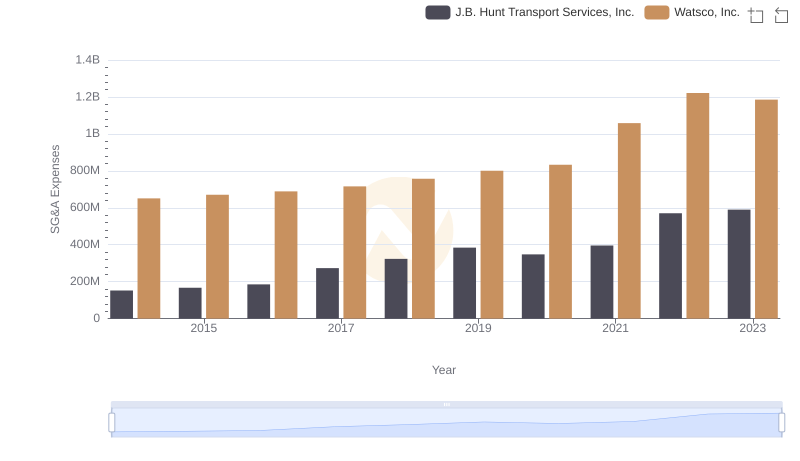
Operational Costs Compared: SG&A Analysis of Watsco, Inc. and J.B. Hunt Transport Services, Inc.
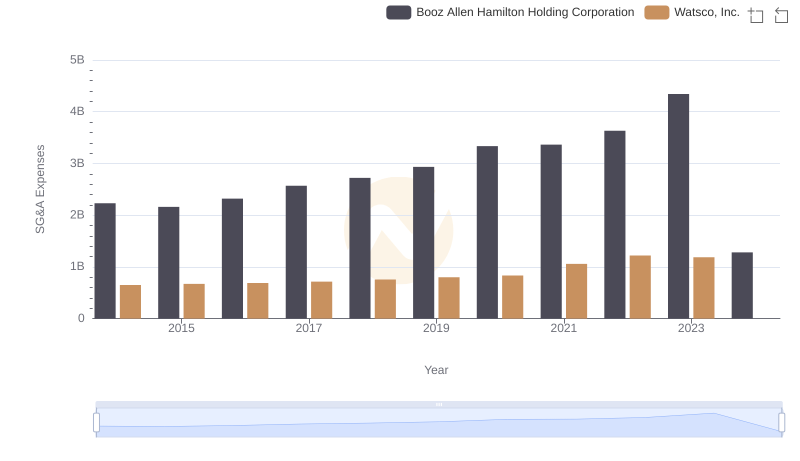
Comparing SG&A Expenses: Watsco, Inc. vs Booz Allen Hamilton Holding Corporation Trends and Insights
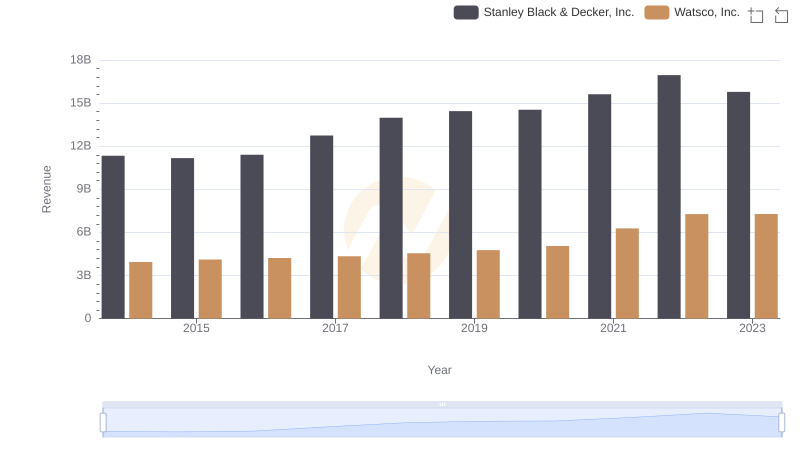
Who Generates More Revenue? Watsco, Inc. or Stanley Black & Decker, Inc.
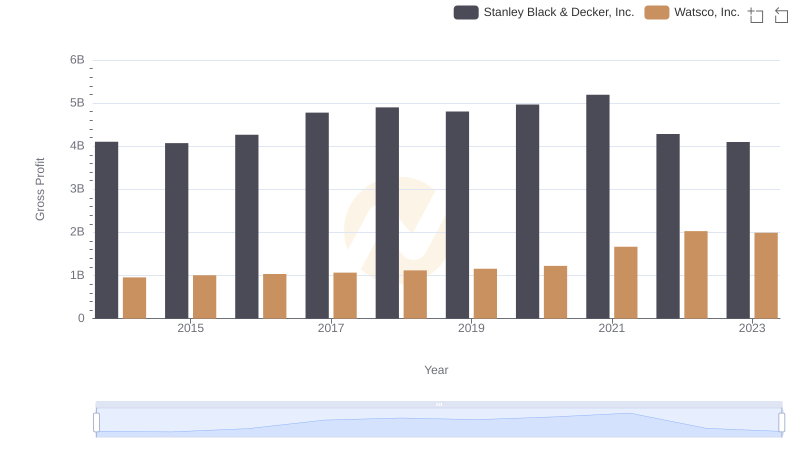
Gross Profit Trends Compared: Watsco, Inc. vs Stanley Black & Decker, Inc.
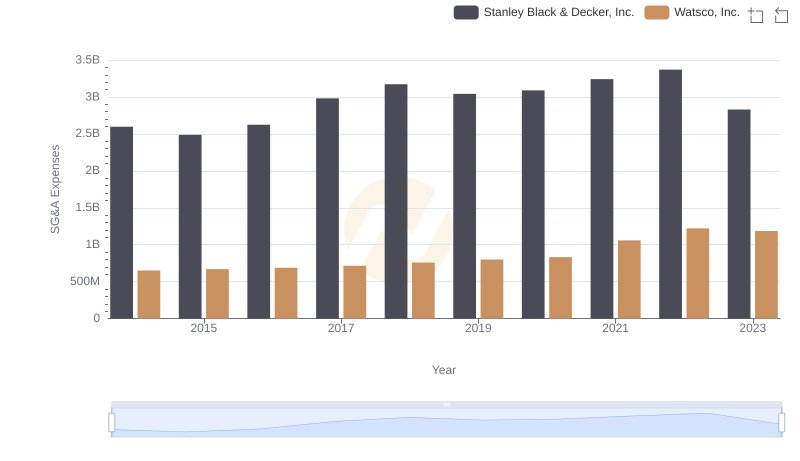
Cost Management Insights: SG&A Expenses for Watsco, Inc. and Stanley Black & Decker, Inc.
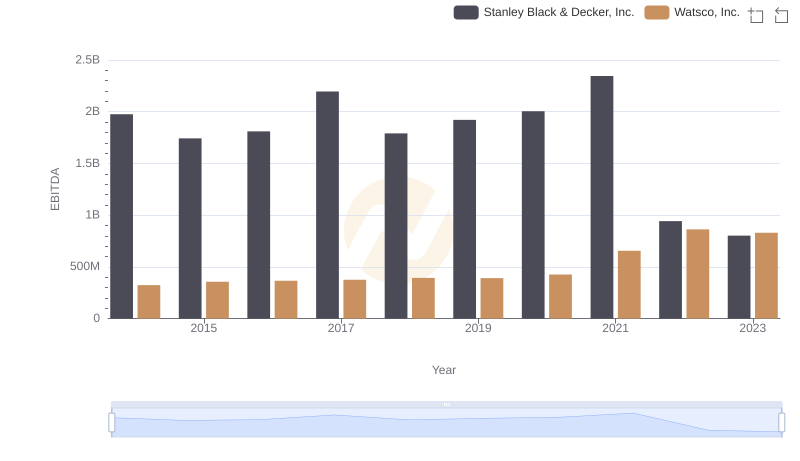
Comparative EBITDA Analysis: Watsco, Inc. vs Stanley Black & Decker, Inc.