| __timestamp | TransUnion | Watsco, Inc. |
|---|---|---|
| Wednesday, January 1, 2014 | 436000000 | 650655000 |
| Thursday, January 1, 2015 | 499700000 | 670609000 |
| Friday, January 1, 2016 | 560100000 | 688952000 |
| Sunday, January 1, 2017 | 585400000 | 715671000 |
| Monday, January 1, 2018 | 707700000 | 757452000 |
| Tuesday, January 1, 2019 | 812100000 | 800328000 |
| Wednesday, January 1, 2020 | 860300000 | 833051000 |
| Friday, January 1, 2021 | 943900000 | 1058316000 |
| Saturday, January 1, 2022 | 1337400000 | 1221382000 |
| Sunday, January 1, 2023 | 1171600000 | 1185626000 |
| Monday, January 1, 2024 | 1239300000 | 1262938000 |
Data in motion
In the ever-evolving landscape of corporate finance, understanding Selling, General, and Administrative (SG&A) expenses is crucial for investors and analysts alike. Over the past decade, Watsco, Inc. and TransUnion have demonstrated intriguing trends in their SG&A expenditures. From 2014 to 2023, Watsco, Inc. consistently maintained higher SG&A expenses compared to TransUnion, peaking in 2022 with a 22% increase from 2014. Meanwhile, TransUnion's SG&A expenses surged by approximately 207% over the same period, reflecting its aggressive growth strategy. Notably, both companies experienced a significant rise in 2022, with TransUnion reaching its highest at 1.34 billion, a testament to its expanding operations. This comparative analysis not only highlights the financial strategies of these industry giants but also offers insights into their operational efficiencies and market positioning.
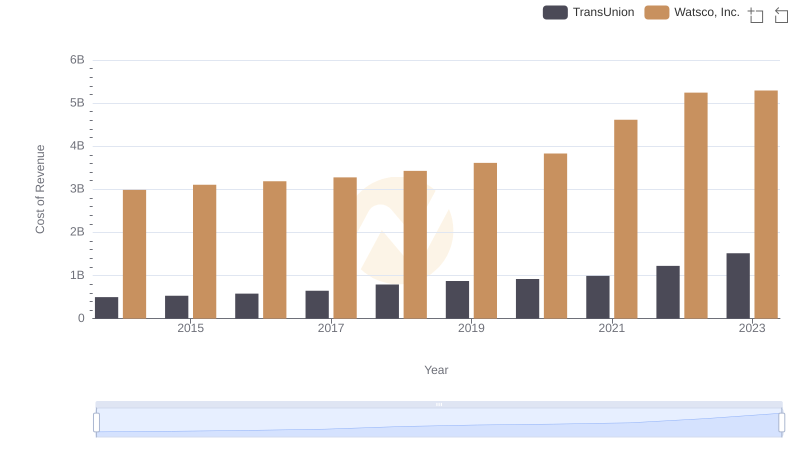
Cost Insights: Breaking Down Watsco, Inc. and TransUnion's Expenses
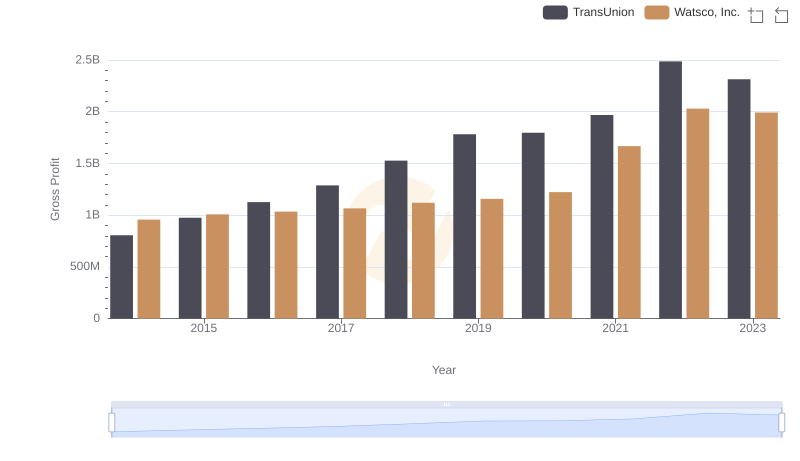
Gross Profit Comparison: Watsco, Inc. and TransUnion Trends
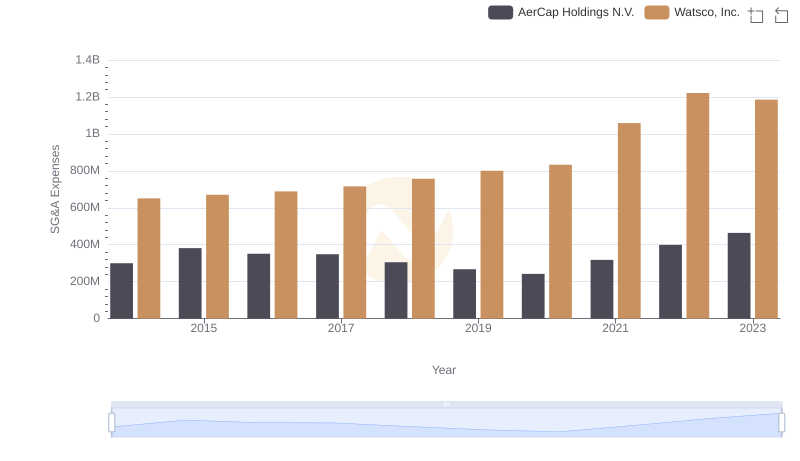
Breaking Down SG&A Expenses: Watsco, Inc. vs AerCap Holdings N.V.
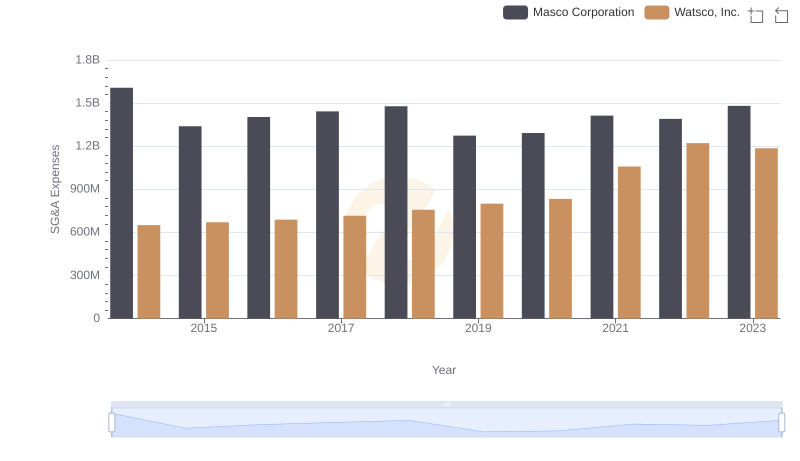
SG&A Efficiency Analysis: Comparing Watsco, Inc. and Masco Corporation
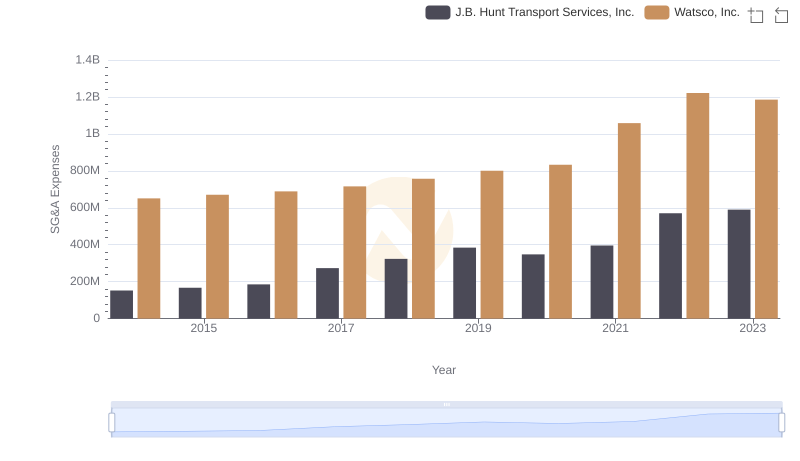
Operational Costs Compared: SG&A Analysis of Watsco, Inc. and J.B. Hunt Transport Services, Inc.
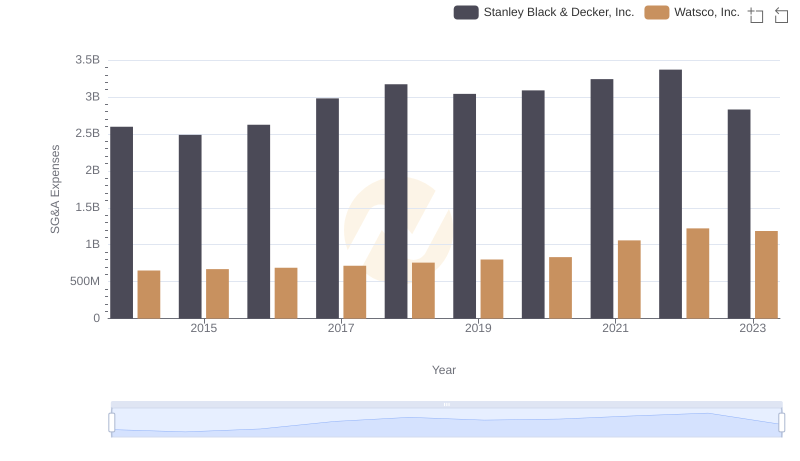
Breaking Down SG&A Expenses: Watsco, Inc. vs Stanley Black & Decker, Inc.
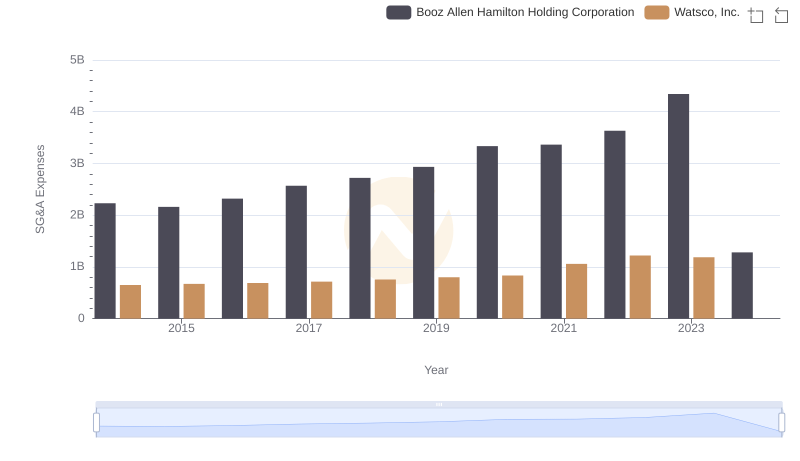
Comparing SG&A Expenses: Watsco, Inc. vs Booz Allen Hamilton Holding Corporation Trends and Insights
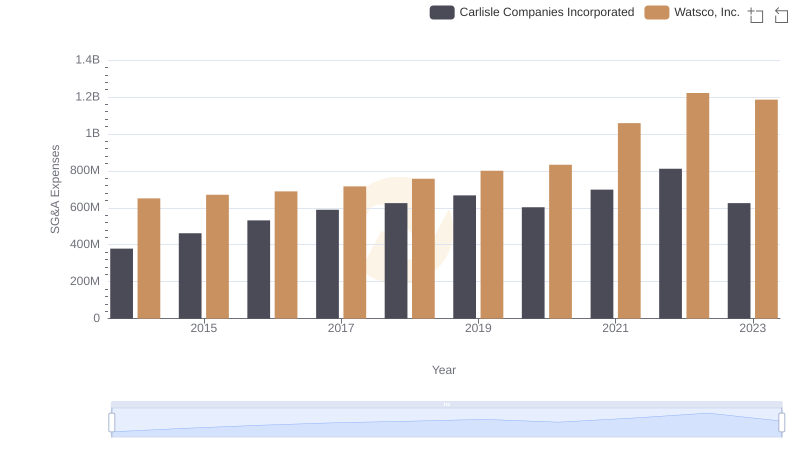
Watsco, Inc. and Carlisle Companies Incorporated: SG&A Spending Patterns Compared