| __timestamp | United Airlines Holdings, Inc. | United Rentals, Inc. |
|---|---|---|
| Wednesday, January 1, 2014 | 38901000000 | 5685000000 |
| Thursday, January 1, 2015 | 37864000000 | 5817000000 |
| Friday, January 1, 2016 | 36556000000 | 5762000000 |
| Sunday, January 1, 2017 | 37736000000 | 6641000000 |
| Monday, January 1, 2018 | 41303000000 | 8047000000 |
| Tuesday, January 1, 2019 | 43259000000 | 9351000000 |
| Wednesday, January 1, 2020 | 15355000000 | 8530000000 |
| Friday, January 1, 2021 | 24634000000 | 9716000000 |
| Saturday, January 1, 2022 | 44955000000 | 11642000000 |
| Sunday, January 1, 2023 | 53717000000 | 14332000000 |
| Monday, January 1, 2024 | 57063000000 | 15345000000 |
Unlocking the unknown
In the ever-evolving landscape of American industry, United Rentals, Inc. and United Airlines Holdings, Inc. stand as titans in their respective fields. Over the past decade, these companies have showcased remarkable resilience and growth. United Airlines, a leader in the aviation sector, saw its revenue soar by approximately 38% from 2014 to 2023, despite a significant dip in 2020 due to the global pandemic. Meanwhile, United Rentals, a powerhouse in equipment rental, experienced a staggering 152% increase in revenue over the same period, reflecting its robust expansion strategy.
The data reveals a fascinating narrative of recovery and growth, with United Airlines rebounding strongly post-2020, while United Rentals consistently climbed, even during challenging times. As we look to the future, these trends highlight the dynamic nature of these industries and the strategic maneuvers that drive their success.
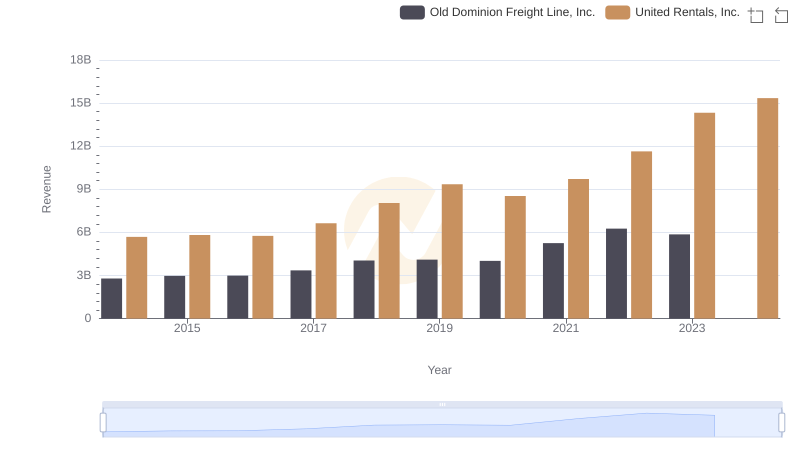
Who Generates More Revenue? United Rentals, Inc. or Old Dominion Freight Line, Inc.
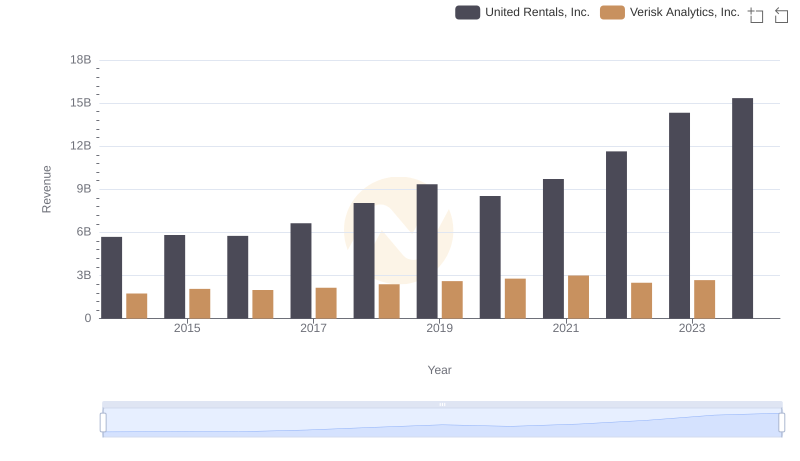
Revenue Insights: United Rentals, Inc. and Verisk Analytics, Inc. Performance Compared
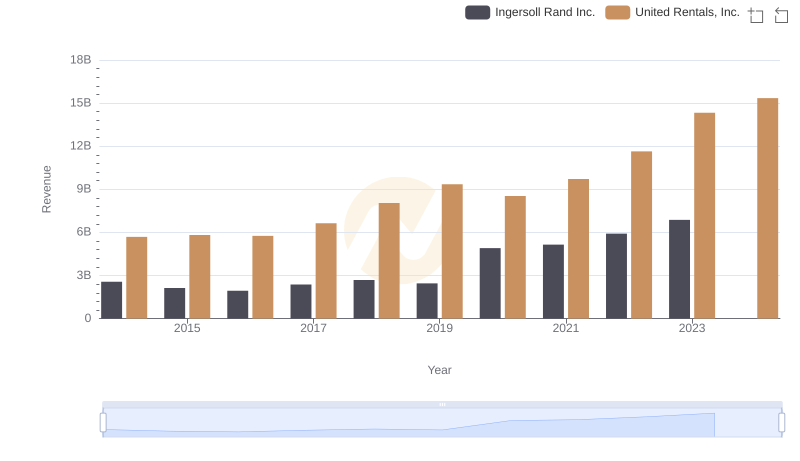
United Rentals, Inc. vs Ingersoll Rand Inc.: Examining Key Revenue Metrics
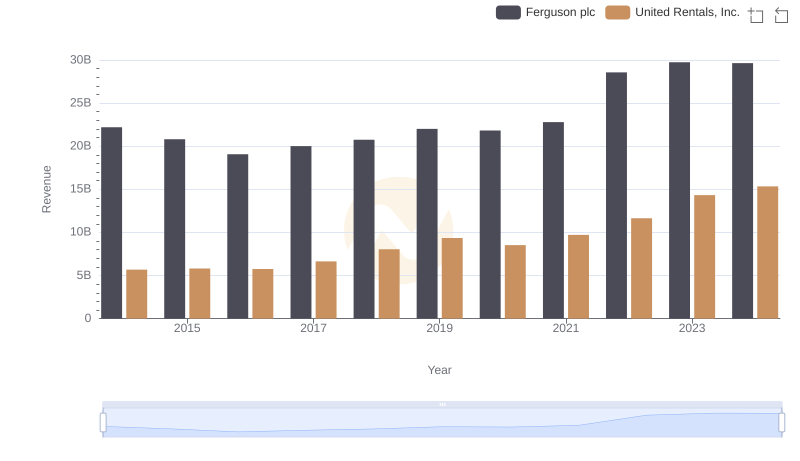
United Rentals, Inc. or Ferguson plc: Who Leads in Yearly Revenue?
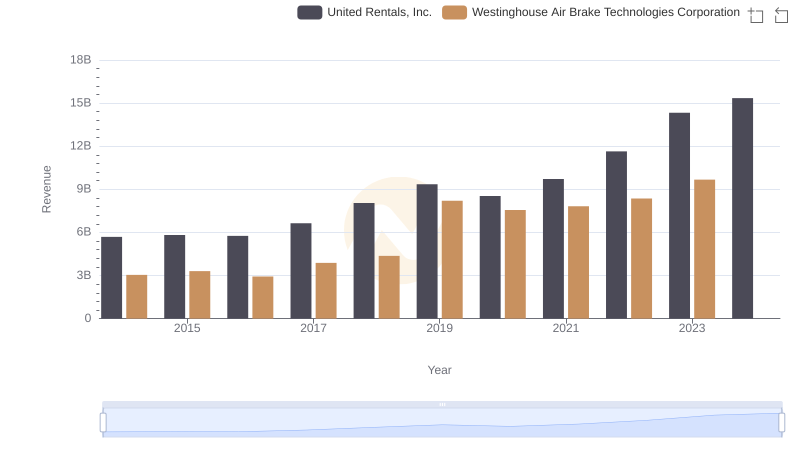
United Rentals, Inc. and Westinghouse Air Brake Technologies Corporation: A Comprehensive Revenue Analysis
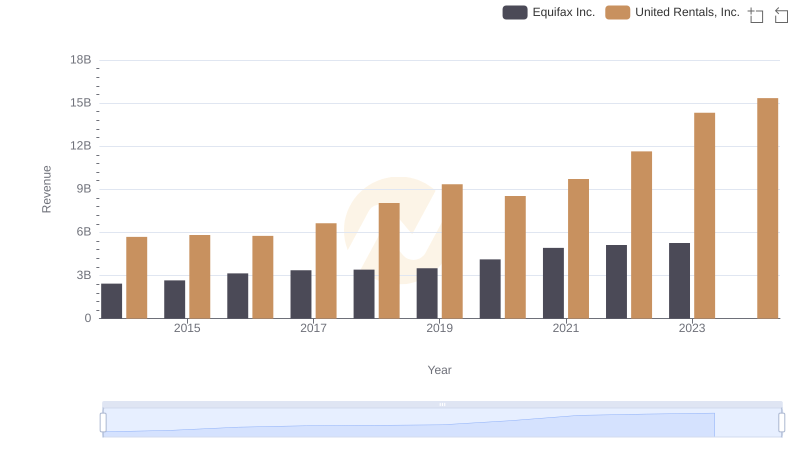
United Rentals, Inc. vs Equifax Inc.: Annual Revenue Growth Compared
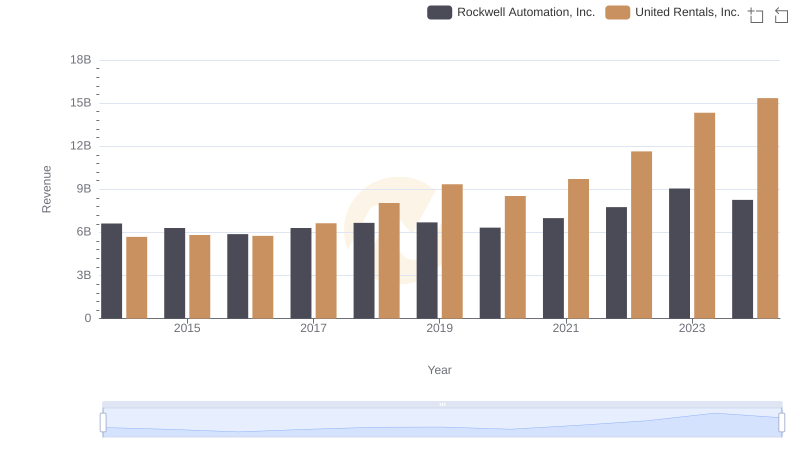
Annual Revenue Comparison: United Rentals, Inc. vs Rockwell Automation, Inc.
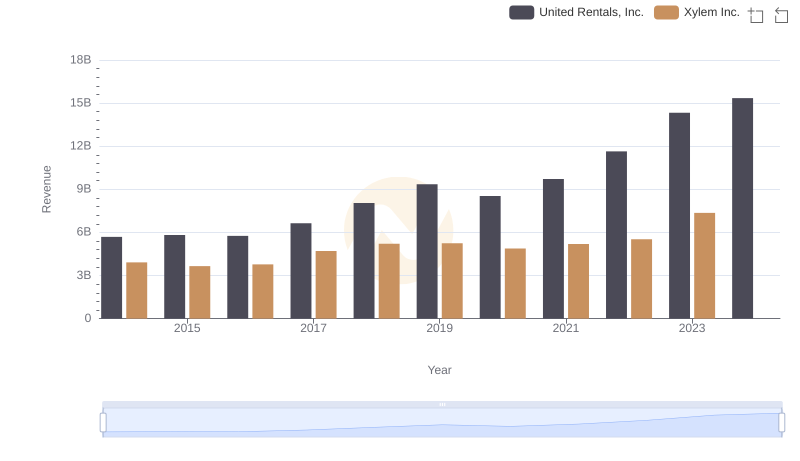
United Rentals, Inc. vs Xylem Inc.: Examining Key Revenue Metrics
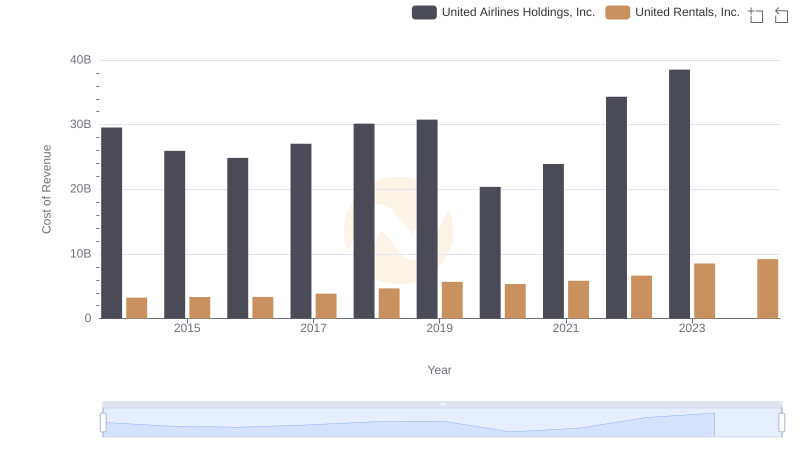
Cost Insights: Breaking Down United Rentals, Inc. and United Airlines Holdings, Inc.'s Expenses
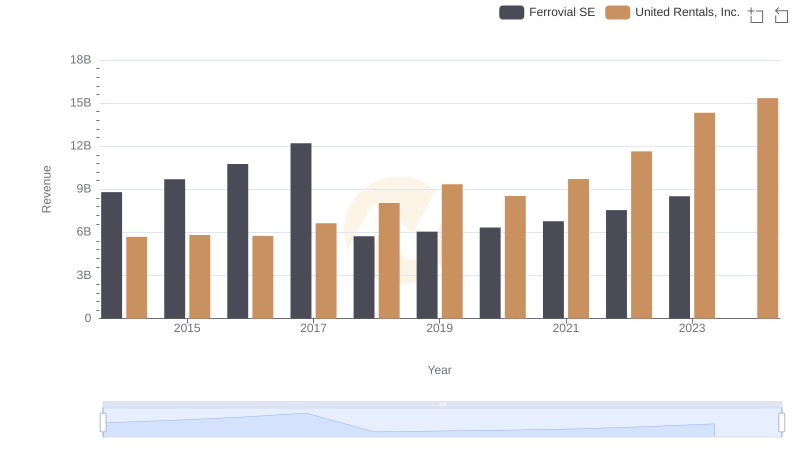
United Rentals, Inc. or Ferrovial SE: Who Leads in Yearly Revenue?
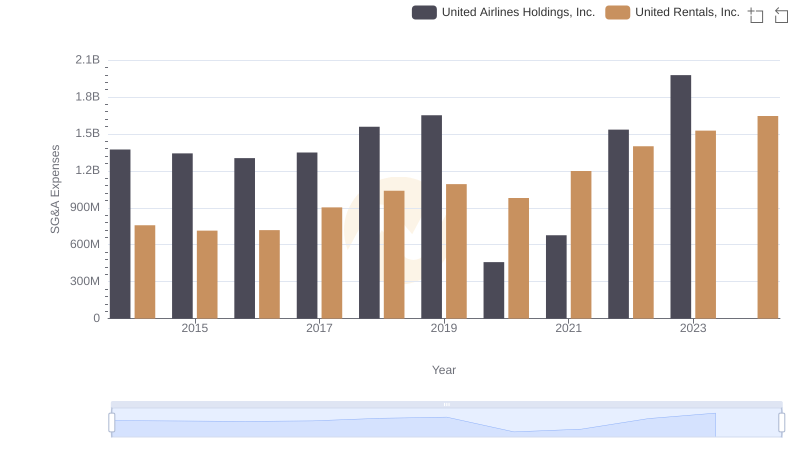
SG&A Efficiency Analysis: Comparing United Rentals, Inc. and United Airlines Holdings, Inc.