| __timestamp | Equifax Inc. | United Rentals, Inc. |
|---|---|---|
| Wednesday, January 1, 2014 | 751700000 | 758000000 |
| Thursday, January 1, 2015 | 884300000 | 714000000 |
| Friday, January 1, 2016 | 948200000 | 719000000 |
| Sunday, January 1, 2017 | 1039100000 | 903000000 |
| Monday, January 1, 2018 | 1213300000 | 1038000000 |
| Tuesday, January 1, 2019 | 1990200000 | 1092000000 |
| Wednesday, January 1, 2020 | 1322500000 | 979000000 |
| Friday, January 1, 2021 | 1324600000 | 1199000000 |
| Saturday, January 1, 2022 | 1328900000 | 1400000000 |
| Sunday, January 1, 2023 | 1385700000 | 1527000000 |
| Monday, January 1, 2024 | 1450500000 | 1645000000 |
Unlocking the unknown
In the ever-evolving landscape of corporate finance, understanding the trends in Selling, General, and Administrative (SG&A) expenses is crucial for investors and analysts alike. This chart provides a comparative analysis of SG&A expenses for United Rentals, Inc. and Equifax Inc. from 2014 to 2023. Over this period, Equifax Inc. saw a steady increase in SG&A expenses, peaking in 2019 with a 165% rise from 2014 levels. Meanwhile, United Rentals, Inc. demonstrated a more volatile pattern, with a notable 115% increase by 2023. Interestingly, 2024 data for Equifax is missing, highlighting potential data gaps or reporting delays. This analysis underscores the importance of monitoring SG&A trends as they can significantly impact a company's profitability and operational efficiency. Investors should consider these trends when evaluating the financial health and strategic direction of these industry giants.
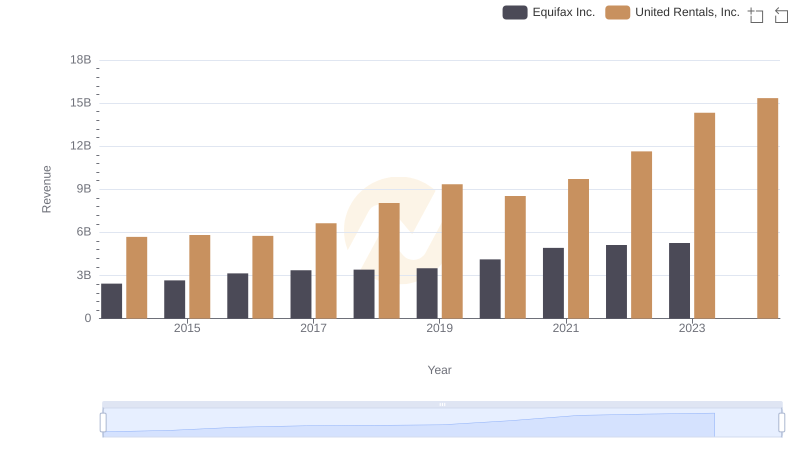
United Rentals, Inc. vs Equifax Inc.: Annual Revenue Growth Compared
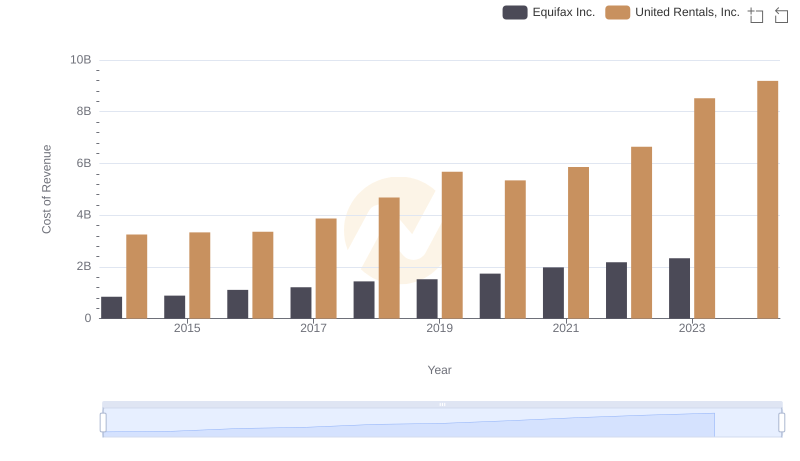
United Rentals, Inc. vs Equifax Inc.: Efficiency in Cost of Revenue Explored
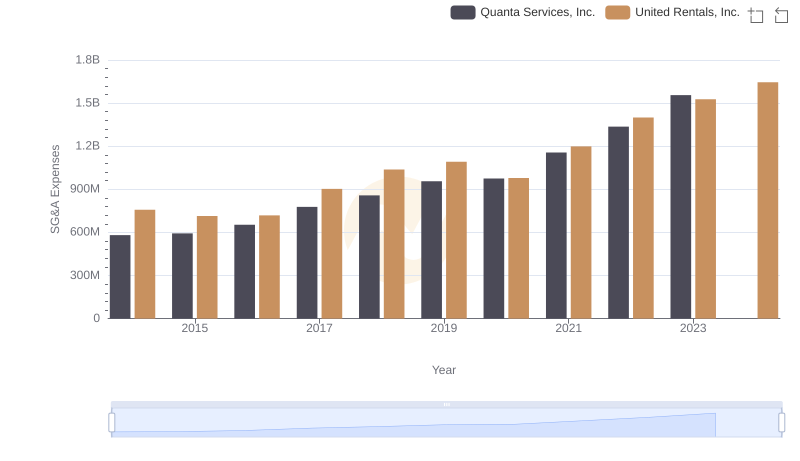
United Rentals, Inc. and Quanta Services, Inc.: SG&A Spending Patterns Compared
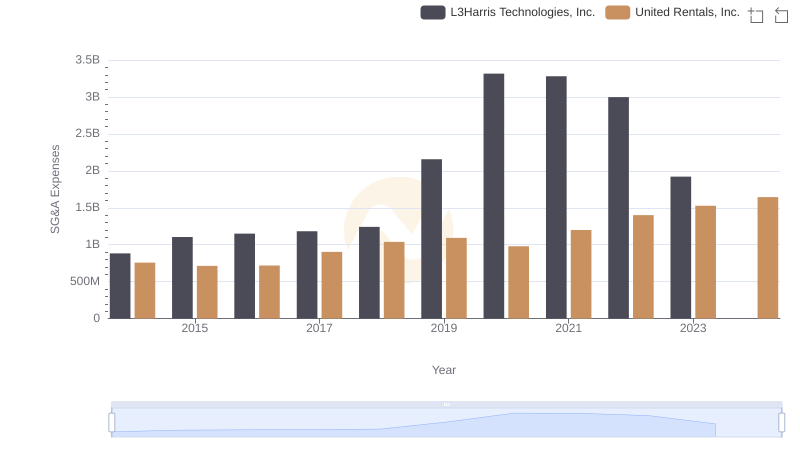
United Rentals, Inc. vs L3Harris Technologies, Inc.: SG&A Expense Trends
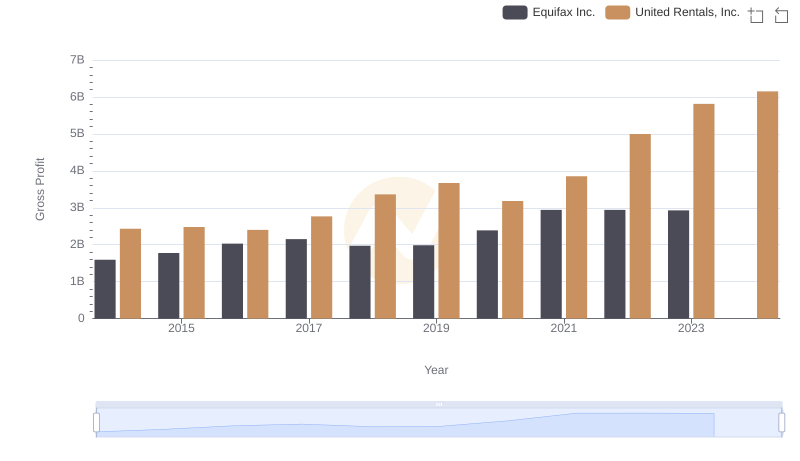
Gross Profit Comparison: United Rentals, Inc. and Equifax Inc. Trends
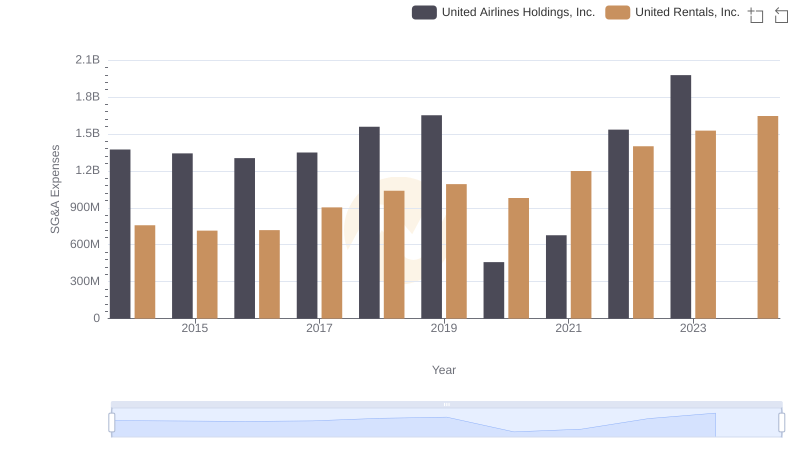
SG&A Efficiency Analysis: Comparing United Rentals, Inc. and United Airlines Holdings, Inc.
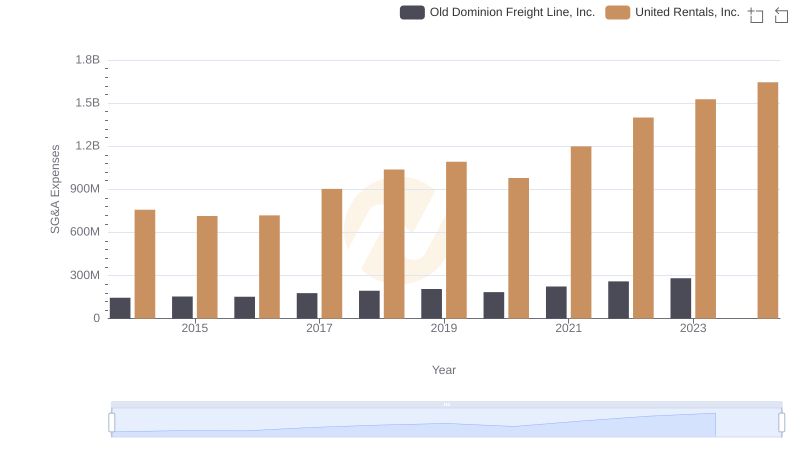
Cost Management Insights: SG&A Expenses for United Rentals, Inc. and Old Dominion Freight Line, Inc.
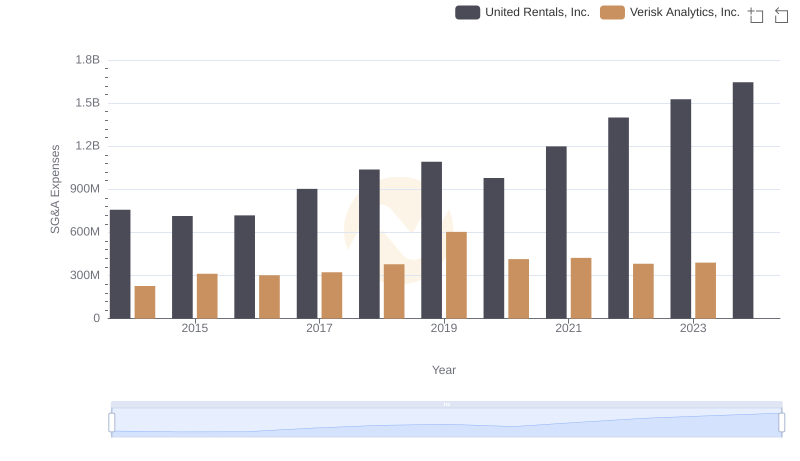
Operational Costs Compared: SG&A Analysis of United Rentals, Inc. and Verisk Analytics, Inc.
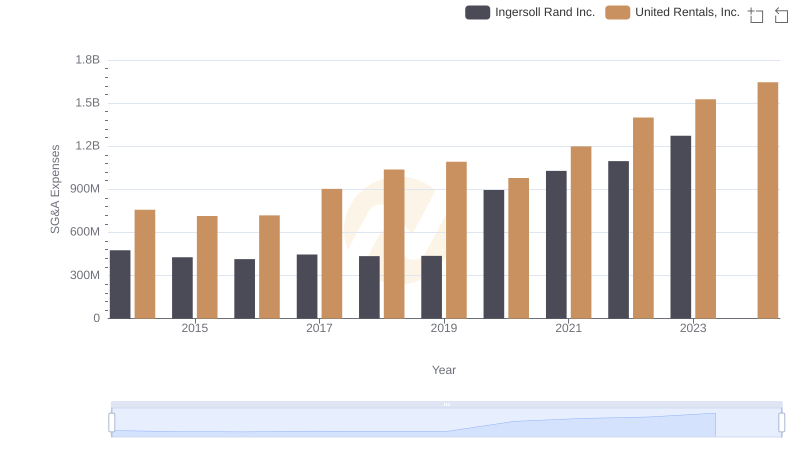
United Rentals, Inc. and Ingersoll Rand Inc.: SG&A Spending Patterns Compared
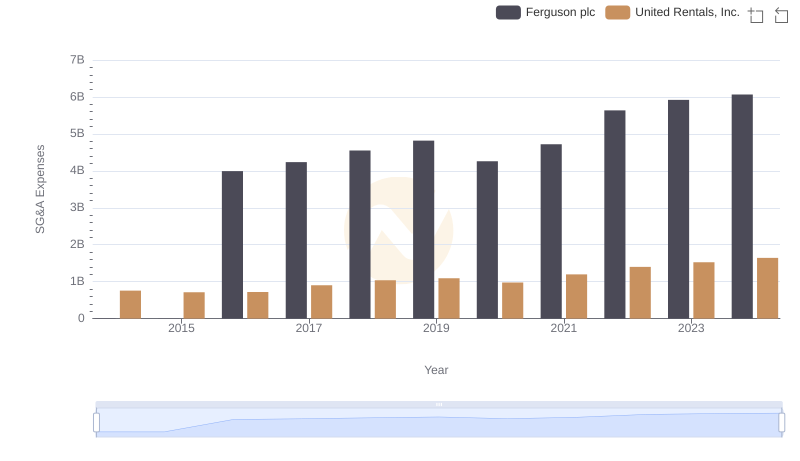
Comparing SG&A Expenses: United Rentals, Inc. vs Ferguson plc Trends and Insights
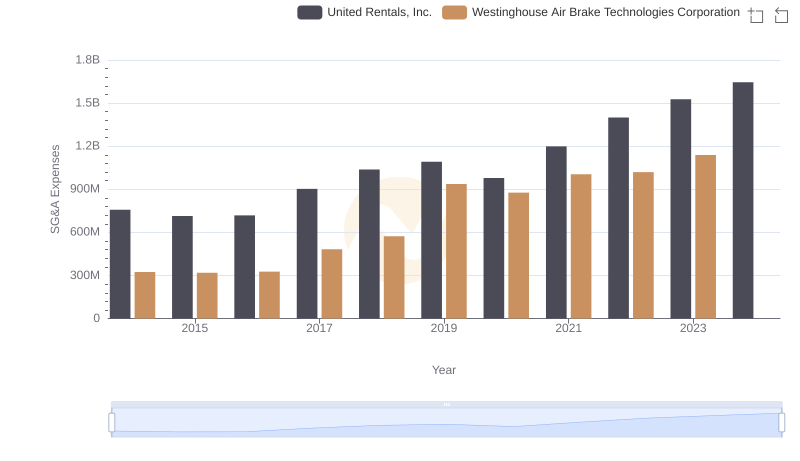
Cost Management Insights: SG&A Expenses for United Rentals, Inc. and Westinghouse Air Brake Technologies Corporation
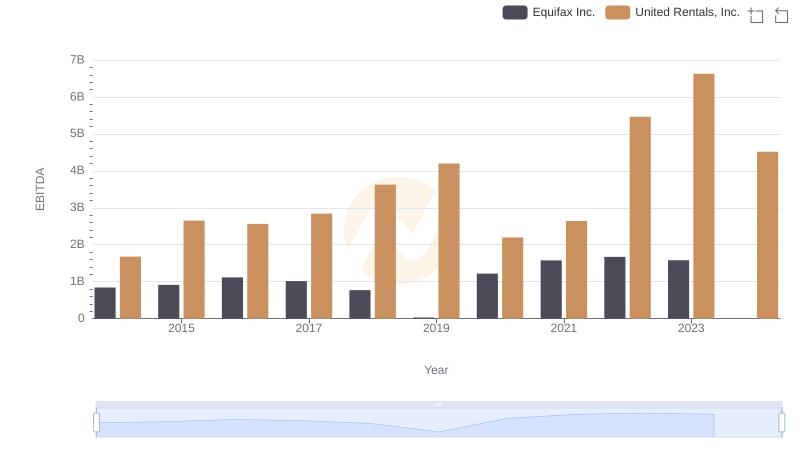
EBITDA Performance Review: United Rentals, Inc. vs Equifax Inc.