| __timestamp | Parker-Hannifin Corporation | Snap-on Incorporated |
|---|---|---|
| Wednesday, January 1, 2014 | 1633992000 | 1047900000 |
| Thursday, January 1, 2015 | 1544746000 | 1009100000 |
| Friday, January 1, 2016 | 1359360000 | 1001400000 |
| Sunday, January 1, 2017 | 1453935000 | 1101300000 |
| Monday, January 1, 2018 | 1657152000 | 1080700000 |
| Tuesday, January 1, 2019 | 1543939000 | 1071500000 |
| Wednesday, January 1, 2020 | 1656553000 | 1054800000 |
| Friday, January 1, 2021 | 1527302000 | 1202300000 |
| Saturday, January 1, 2022 | 1627116000 | 1181200000 |
| Sunday, January 1, 2023 | 3354103000 | 1249000000 |
| Monday, January 1, 2024 | 3315177000 | 0 |
Data in motion
In the competitive landscape of industrial manufacturing, understanding the efficiency of Selling, General, and Administrative (SG&A) expenses is crucial. Parker-Hannifin Corporation and Snap-on Incorporated, two stalwarts in the industry, offer a fascinating study in contrasts over the past decade.
From 2014 to 2023, Parker-Hannifin's SG&A expenses have shown a remarkable increase, peaking in 2023 with a staggering 80% rise compared to 2014. This surge reflects strategic investments and expansions. In contrast, Snap-on Incorporated maintained a more stable trajectory, with expenses growing by approximately 19% over the same period, indicating a focus on operational efficiency.
Interestingly, 2024 data for Snap-on is missing, leaving room for speculation on future trends. This analysis underscores the diverse strategies employed by these industry leaders, offering valuable insights for investors and analysts alike.
Explore the chart to delve deeper into this financial narrative.
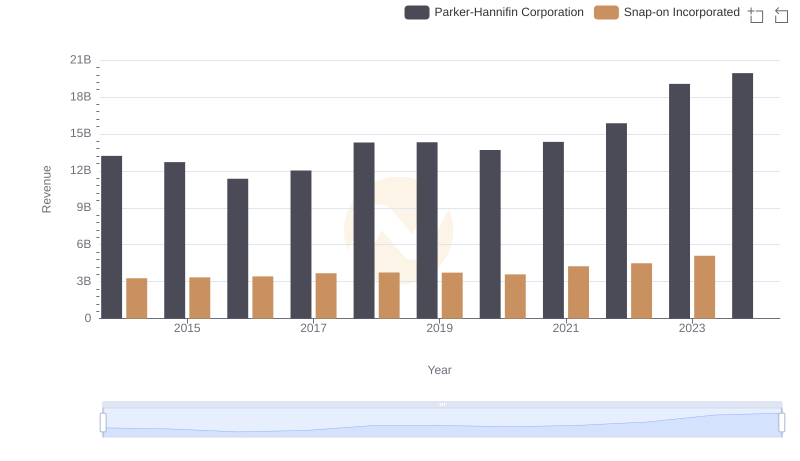
Revenue Showdown: Parker-Hannifin Corporation vs Snap-on Incorporated
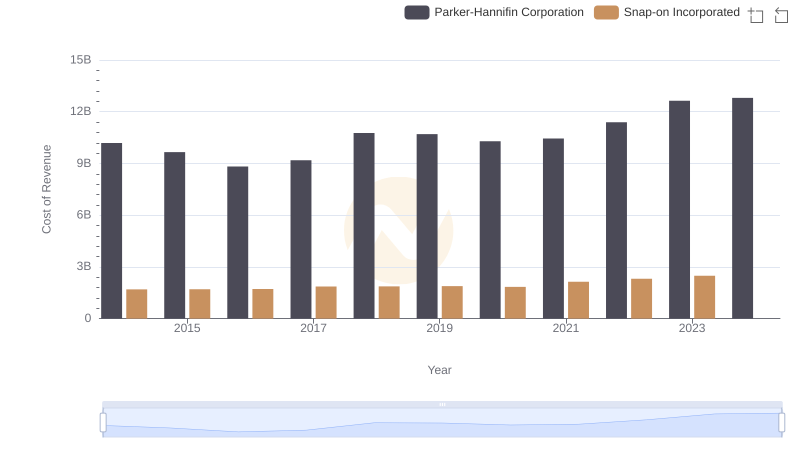
Analyzing Cost of Revenue: Parker-Hannifin Corporation and Snap-on Incorporated
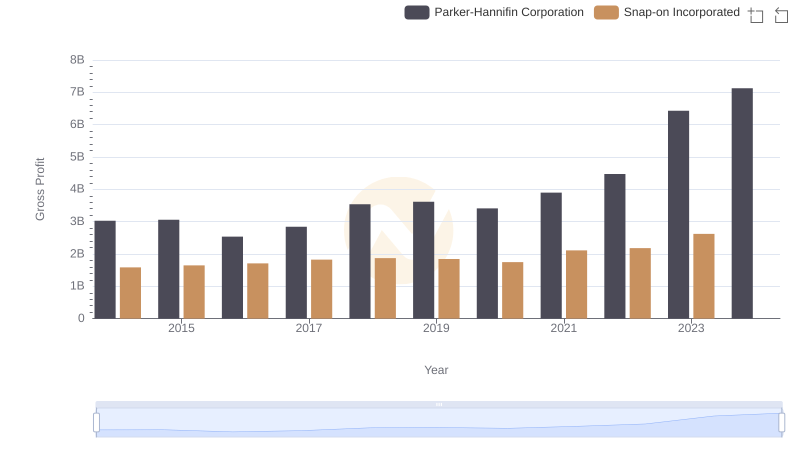
Gross Profit Trends Compared: Parker-Hannifin Corporation vs Snap-on Incorporated
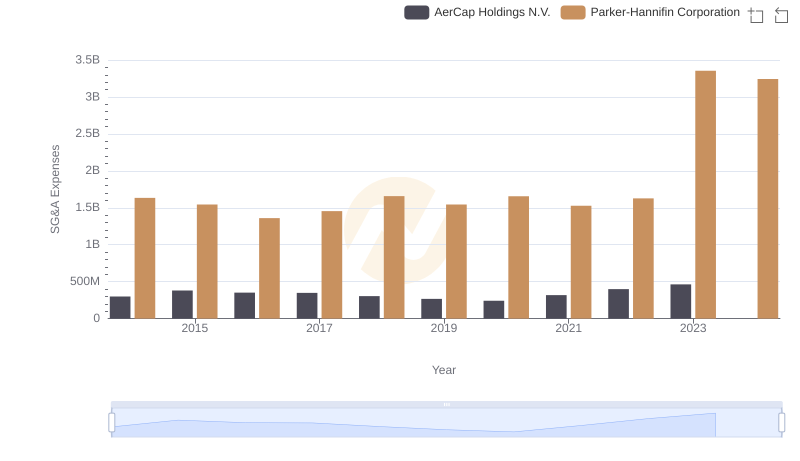
Who Optimizes SG&A Costs Better? Parker-Hannifin Corporation or AerCap Holdings N.V.
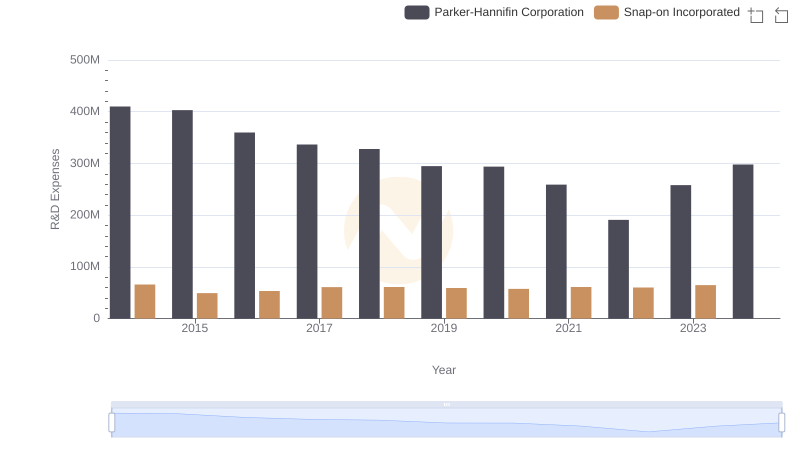
Research and Development Expenses Breakdown: Parker-Hannifin Corporation vs Snap-on Incorporated
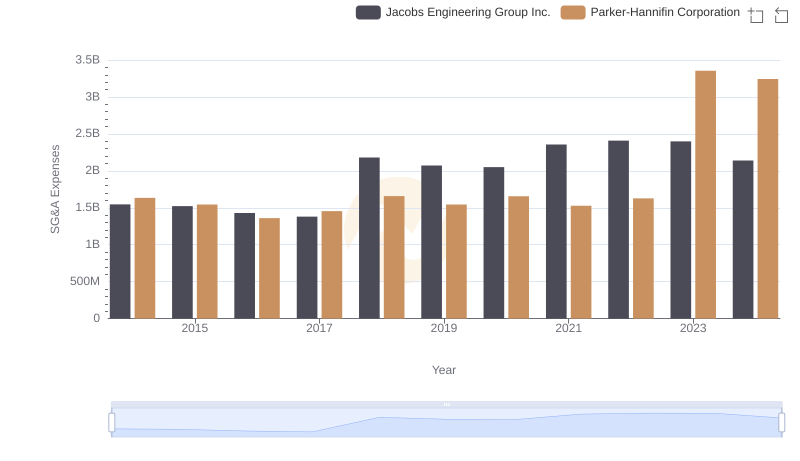
Breaking Down SG&A Expenses: Parker-Hannifin Corporation vs Jacobs Engineering Group Inc.
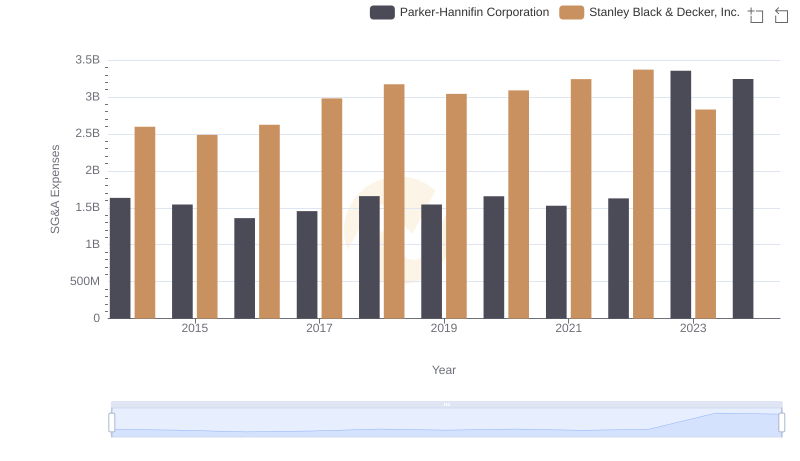
Operational Costs Compared: SG&A Analysis of Parker-Hannifin Corporation and Stanley Black & Decker, Inc.
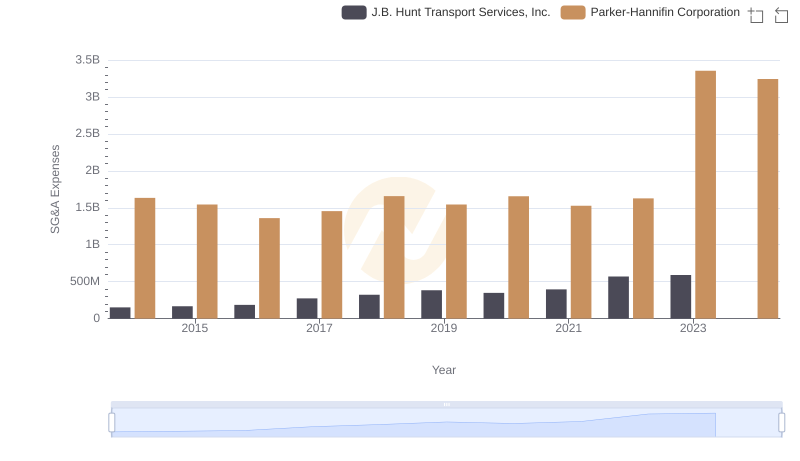
Breaking Down SG&A Expenses: Parker-Hannifin Corporation vs J.B. Hunt Transport Services, Inc.
Breaking Down SG&A Expenses: Parker-Hannifin Corporation vs Booz Allen Hamilton Holding Corporation
EBITDA Performance Review: Parker-Hannifin Corporation vs Snap-on Incorporated