| __timestamp | J.B. Hunt Transport Services, Inc. | Parker-Hannifin Corporation |
|---|---|---|
| Wednesday, January 1, 2014 | 152469000 | 1633992000 |
| Thursday, January 1, 2015 | 166799000 | 1544746000 |
| Friday, January 1, 2016 | 185436000 | 1359360000 |
| Sunday, January 1, 2017 | 273440000 | 1453935000 |
| Monday, January 1, 2018 | 323587000 | 1657152000 |
| Tuesday, January 1, 2019 | 383981000 | 1543939000 |
| Wednesday, January 1, 2020 | 348076000 | 1656553000 |
| Friday, January 1, 2021 | 395533000 | 1527302000 |
| Saturday, January 1, 2022 | 570191000 | 1627116000 |
| Sunday, January 1, 2023 | 590242000 | 3354103000 |
| Monday, January 1, 2024 | 3315177000 |
In pursuit of knowledge
In the ever-evolving landscape of corporate finance, understanding the nuances of Selling, General, and Administrative (SG&A) expenses is crucial. Over the past decade, Parker-Hannifin Corporation and J.B. Hunt Transport Services, Inc. have showcased distinct financial trajectories. From 2014 to 2023, Parker-Hannifin's SG&A expenses have consistently outpaced those of J.B. Hunt, peaking in 2023 with a staggering 3.35 billion dollars, marking a 105% increase from 2014. In contrast, J.B. Hunt's expenses grew by approximately 287%, reaching 590 million dollars in 2023. This disparity highlights Parker-Hannifin's expansive operational scale compared to J.B. Hunt. Notably, the data for 2024 is incomplete, leaving room for speculation on future trends. As businesses navigate post-pandemic recovery, these insights offer a window into strategic financial management and operational efficiency.
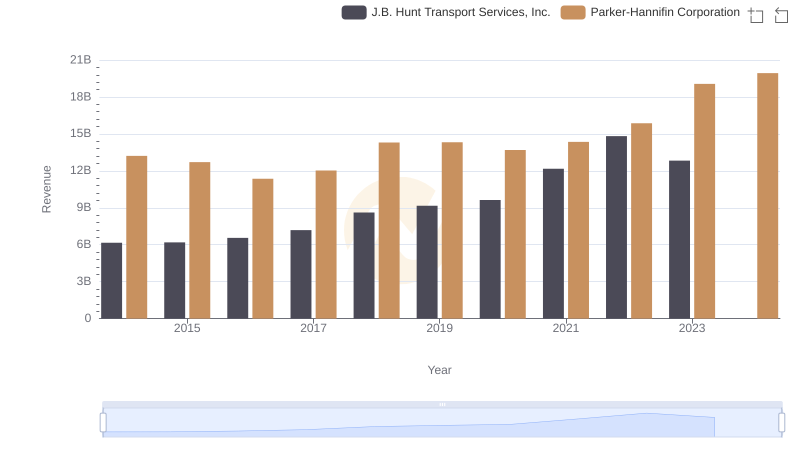
Parker-Hannifin Corporation or J.B. Hunt Transport Services, Inc.: Who Leads in Yearly Revenue?
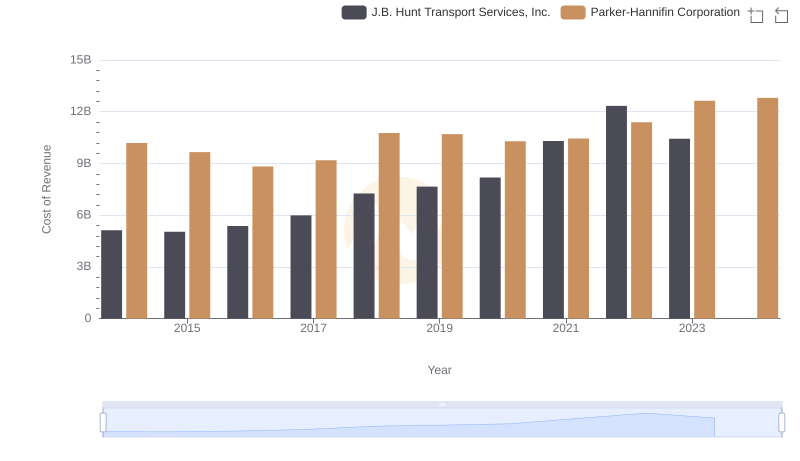
Parker-Hannifin Corporation vs J.B. Hunt Transport Services, Inc.: Efficiency in Cost of Revenue Explored
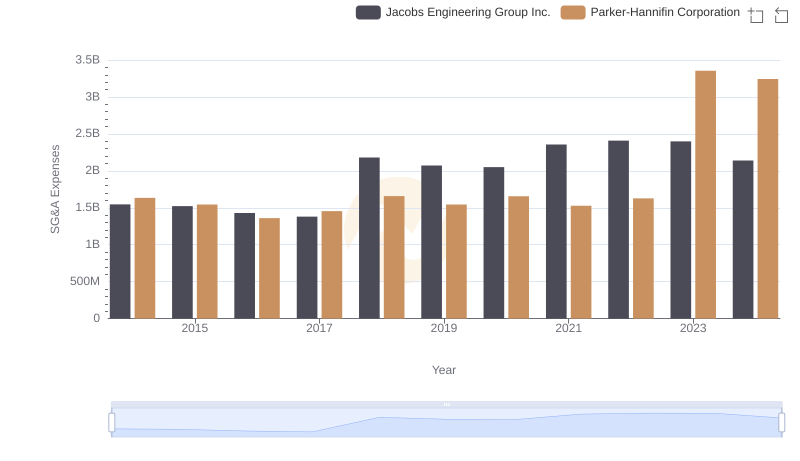
Breaking Down SG&A Expenses: Parker-Hannifin Corporation vs Jacobs Engineering Group Inc.
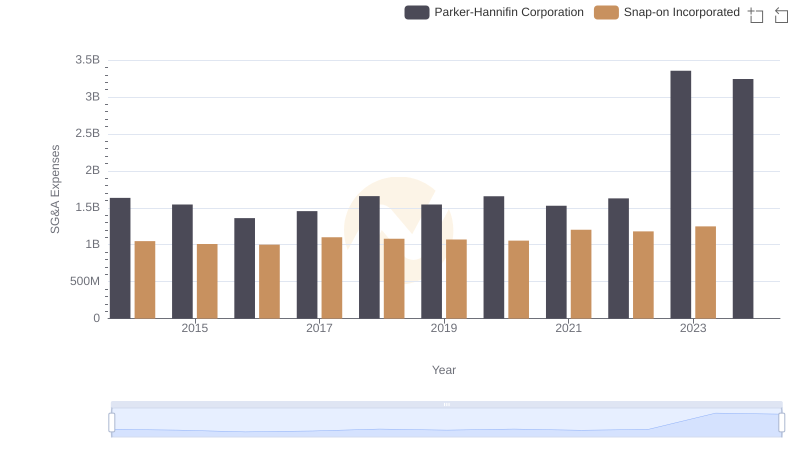
SG&A Efficiency Analysis: Comparing Parker-Hannifin Corporation and Snap-on Incorporated
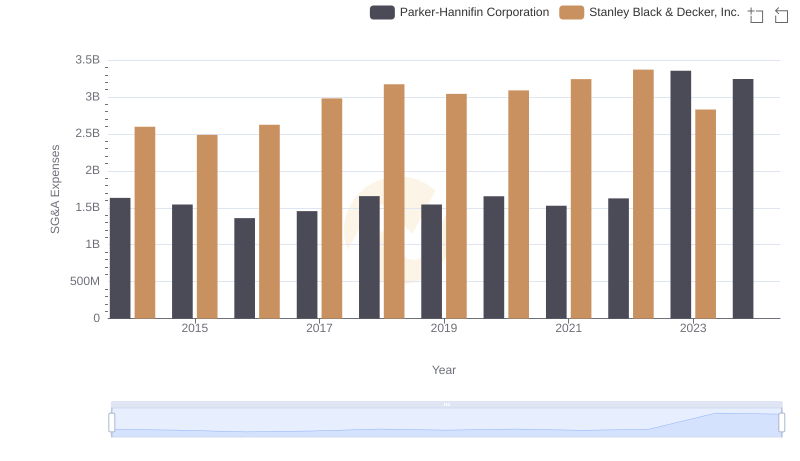
Operational Costs Compared: SG&A Analysis of Parker-Hannifin Corporation and Stanley Black & Decker, Inc.
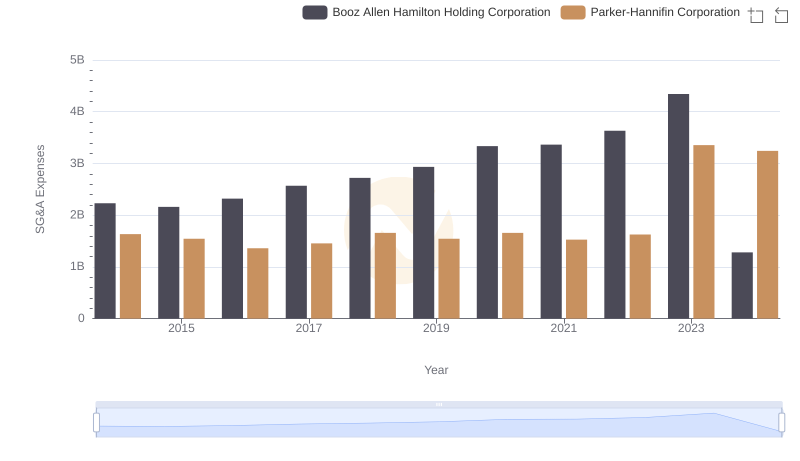
Breaking Down SG&A Expenses: Parker-Hannifin Corporation vs Booz Allen Hamilton Holding Corporation
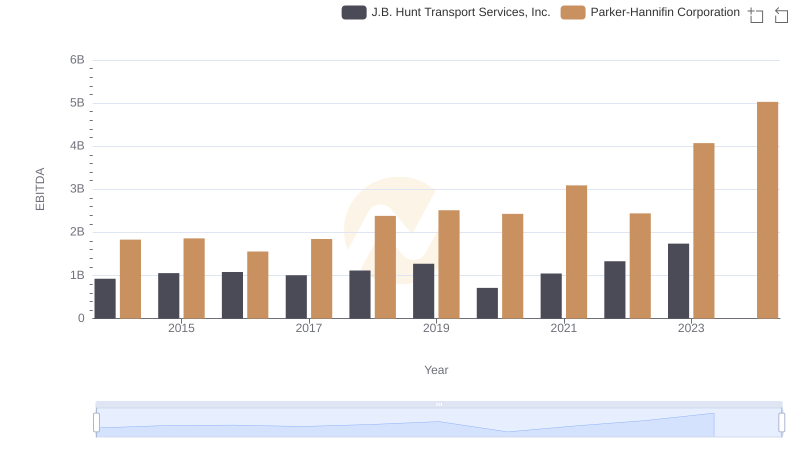
Comprehensive EBITDA Comparison: Parker-Hannifin Corporation vs J.B. Hunt Transport Services, Inc.
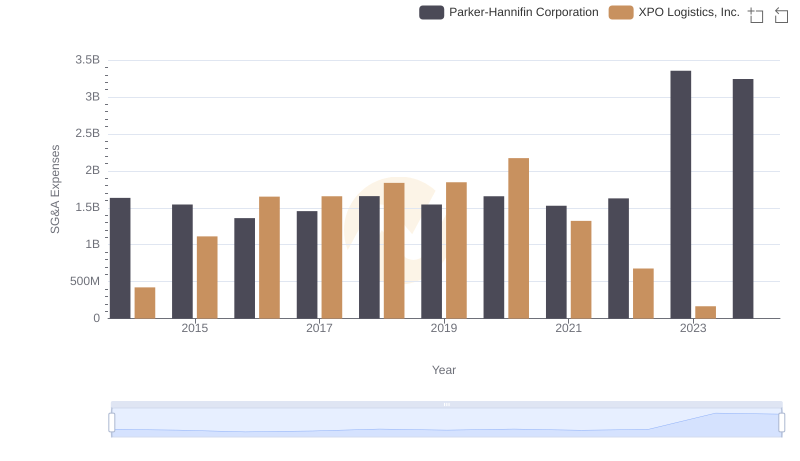
Parker-Hannifin Corporation vs XPO Logistics, Inc.: SG&A Expense Trends