| __timestamp | Parker-Hannifin Corporation | Snap-on Incorporated |
|---|---|---|
| Wednesday, January 1, 2014 | 410132000 | 66000000 |
| Thursday, January 1, 2015 | 403085000 | 49300000 |
| Friday, January 1, 2016 | 359796000 | 53400000 |
| Sunday, January 1, 2017 | 336675000 | 60900000 |
| Monday, January 1, 2018 | 327877000 | 61200000 |
| Tuesday, January 1, 2019 | 294852000 | 59100000 |
| Wednesday, January 1, 2020 | 293837000 | 57400000 |
| Friday, January 1, 2021 | 259039000 | 61100000 |
| Saturday, January 1, 2022 | 191000000 | 60100000 |
| Sunday, January 1, 2023 | 258000000 | 64700000 |
| Monday, January 1, 2024 | 298000000 | 0 |
Igniting the spark of knowledge
In the ever-evolving landscape of industrial innovation, research and development (R&D) expenses serve as a critical indicator of a company's commitment to future growth. Over the past decade, Parker-Hannifin Corporation and Snap-on Incorporated have demonstrated contrasting approaches to R&D investment.
From 2014 to 2023, Parker-Hannifin's R&D expenses have seen a significant decline, dropping by approximately 37% from their peak in 2014. This reduction reflects a strategic shift, possibly towards optimizing existing technologies or reallocating resources to other growth areas.
Conversely, Snap-on has maintained a relatively stable R&D expenditure, with only minor fluctuations. Their consistent investment underscores a steadfast commitment to innovation, ensuring they remain competitive in the tool and equipment industry.
As we look to the future, these trends offer valuable insights into each company's strategic priorities and their potential impact on industry leadership.

Parker-Hannifin Corporation vs Rockwell Automation, Inc.: Strategic Focus on R&D Spending
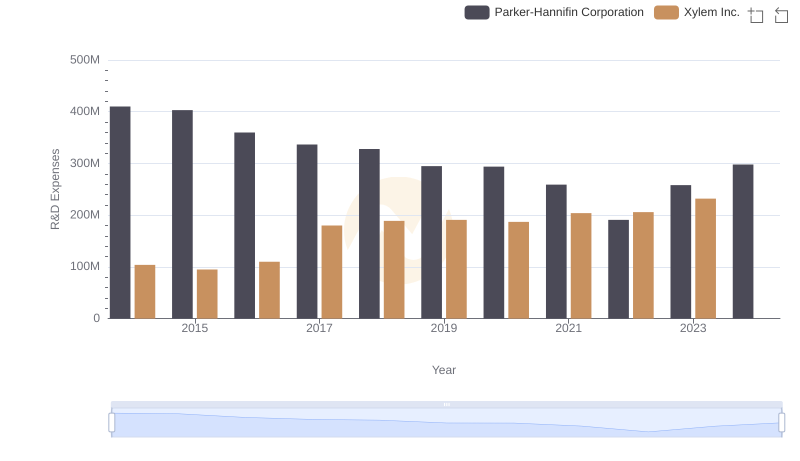
Research and Development Expenses Breakdown: Parker-Hannifin Corporation vs Xylem Inc.
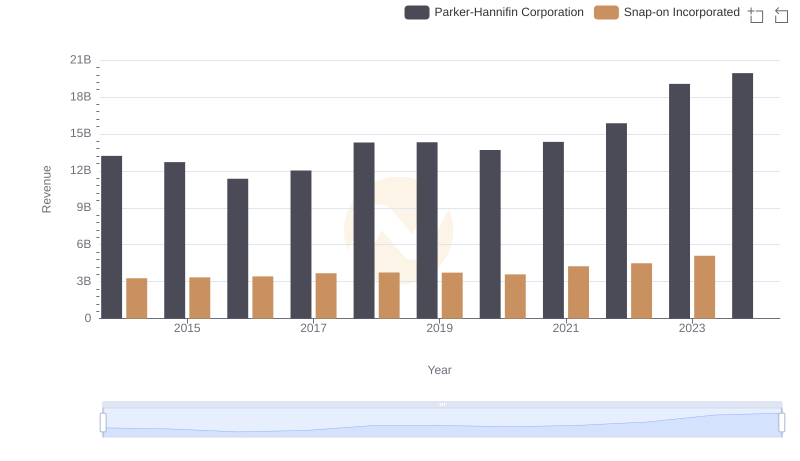
Revenue Showdown: Parker-Hannifin Corporation vs Snap-on Incorporated
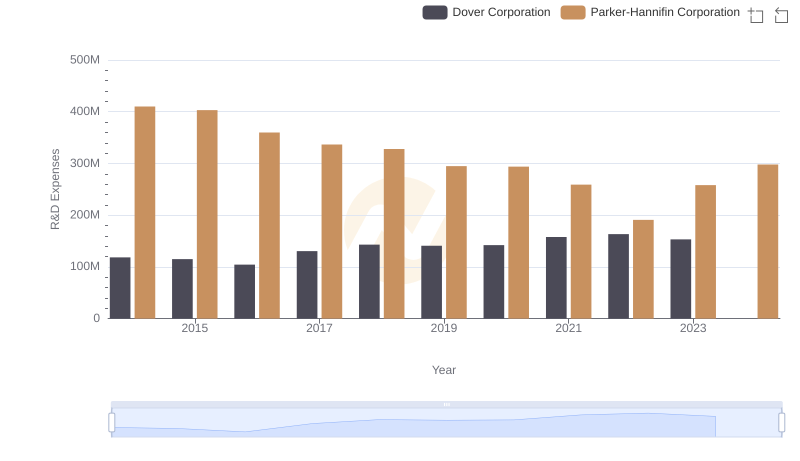
Research and Development: Comparing Key Metrics for Parker-Hannifin Corporation and Dover Corporation
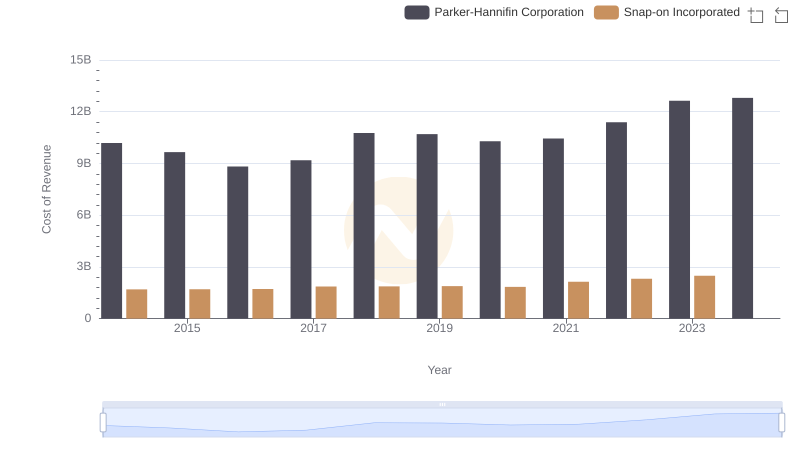
Analyzing Cost of Revenue: Parker-Hannifin Corporation and Snap-on Incorporated
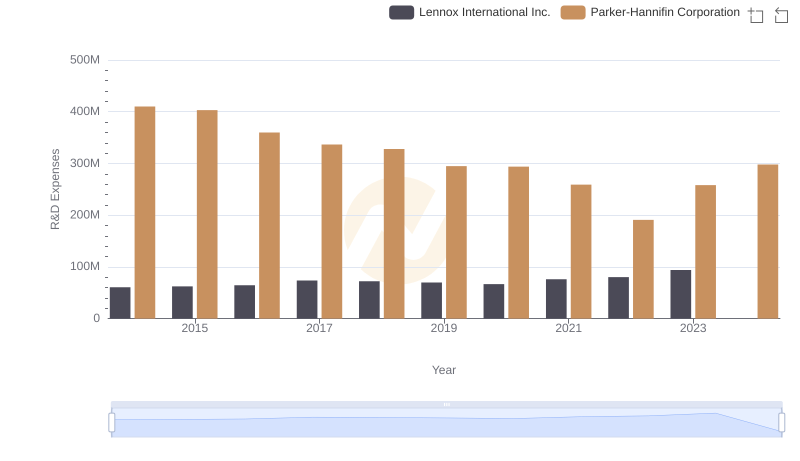
Research and Development: Comparing Key Metrics for Parker-Hannifin Corporation and Lennox International Inc.
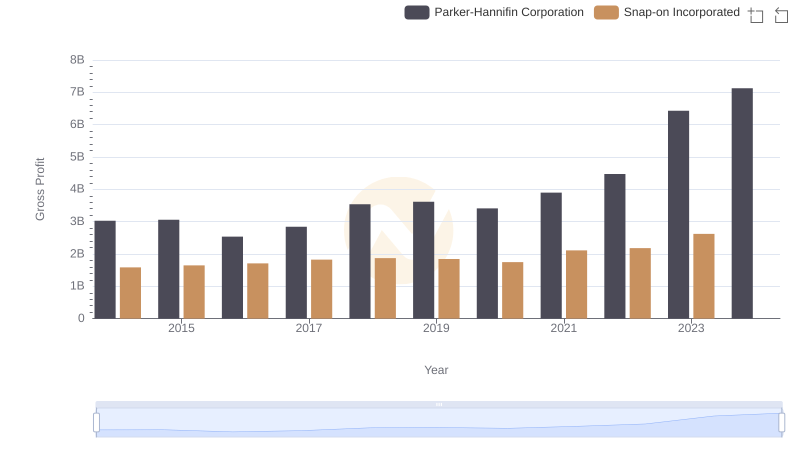
Gross Profit Trends Compared: Parker-Hannifin Corporation vs Snap-on Incorporated
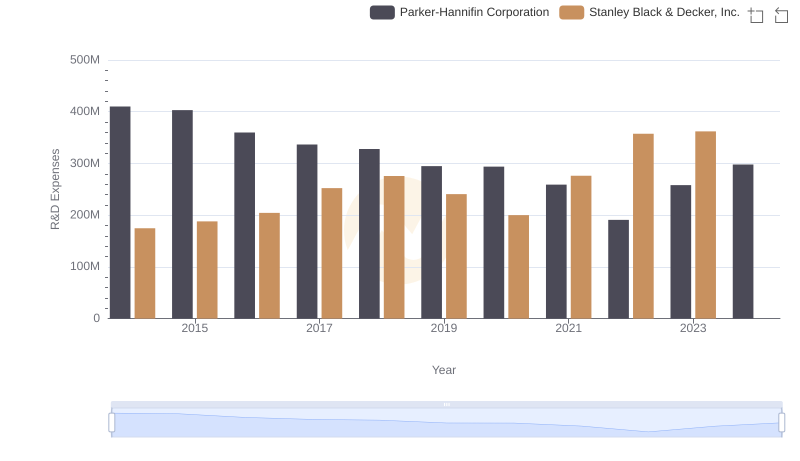
Research and Development Expenses Breakdown: Parker-Hannifin Corporation vs Stanley Black & Decker, Inc.
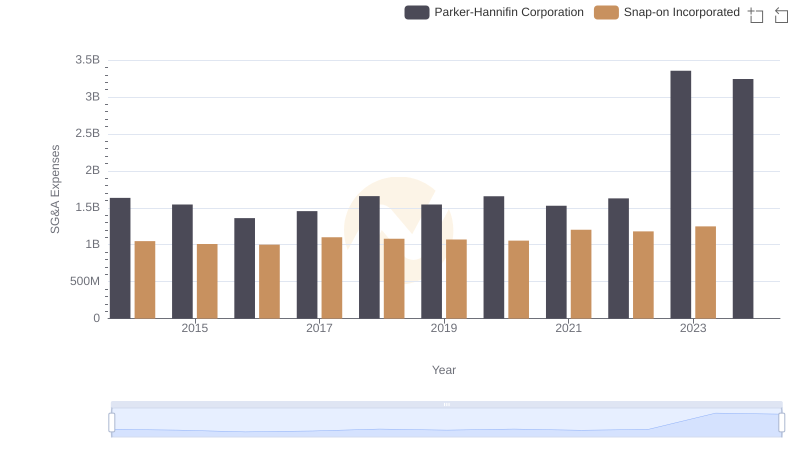
SG&A Efficiency Analysis: Comparing Parker-Hannifin Corporation and Snap-on Incorporated
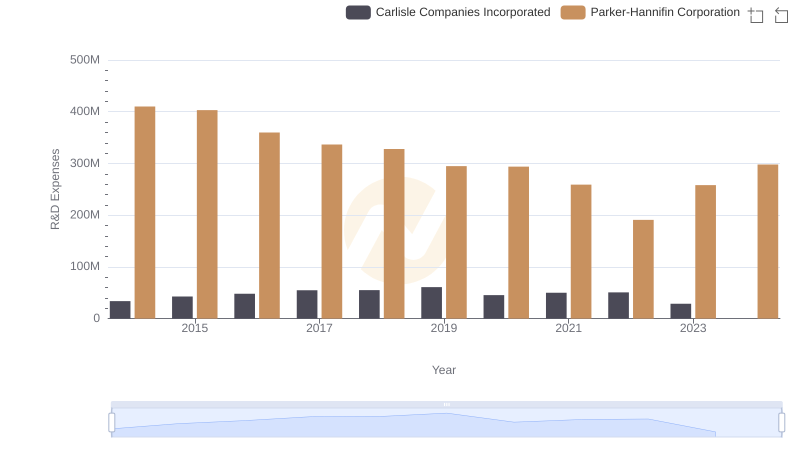
Research and Development: Comparing Key Metrics for Parker-Hannifin Corporation and Carlisle Companies Incorporated
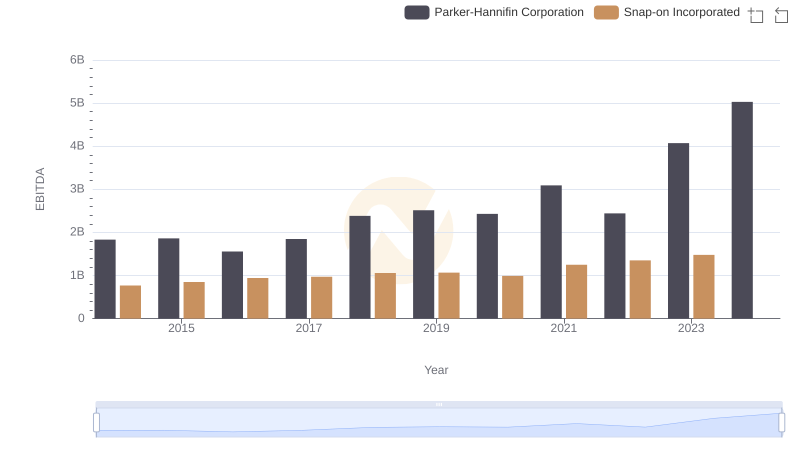
EBITDA Performance Review: Parker-Hannifin Corporation vs Snap-on Incorporated
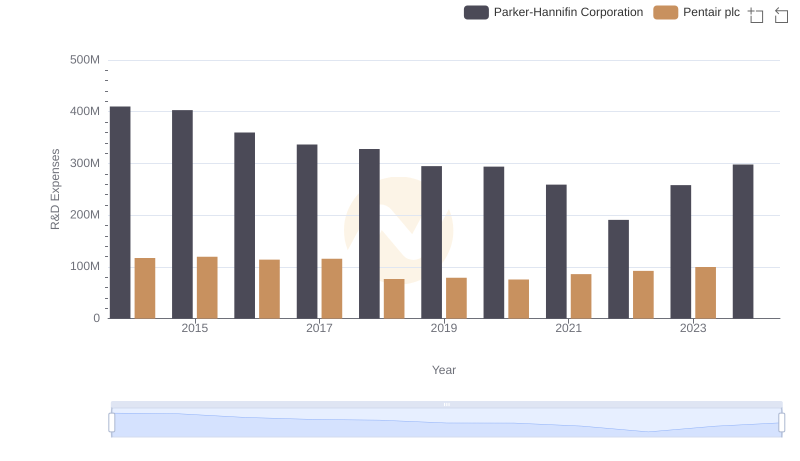
R&D Spending Showdown: Parker-Hannifin Corporation vs Pentair plc