| __timestamp | Parker-Hannifin Corporation | Stanley Black & Decker, Inc. |
|---|---|---|
| Wednesday, January 1, 2014 | 1633992000 | 2595900000 |
| Thursday, January 1, 2015 | 1544746000 | 2486400000 |
| Friday, January 1, 2016 | 1359360000 | 2623900000 |
| Sunday, January 1, 2017 | 1453935000 | 2980100000 |
| Monday, January 1, 2018 | 1657152000 | 3171700000 |
| Tuesday, January 1, 2019 | 1543939000 | 3041000000 |
| Wednesday, January 1, 2020 | 1656553000 | 3089600000 |
| Friday, January 1, 2021 | 1527302000 | 3240400000 |
| Saturday, January 1, 2022 | 1627116000 | 3370000000 |
| Sunday, January 1, 2023 | 3354103000 | 2829300000 |
| Monday, January 1, 2024 | 3315177000 | 3310500000 |
Cracking the code
In the ever-evolving landscape of industrial giants, operational efficiency remains a cornerstone of success. Over the past decade, Parker-Hannifin Corporation and Stanley Black & Decker, Inc. have showcased intriguing trends in their Selling, General, and Administrative (SG&A) expenses. From 2014 to 2023, Parker-Hannifin's SG&A expenses fluctuated, peaking dramatically in 2023 with a 105% increase compared to 2014. Meanwhile, Stanley Black & Decker maintained a more consistent trajectory, with a notable 30% rise in 2022 before a slight dip in 2023.
This analysis highlights the strategic shifts and market responses of these industry leaders. While Parker-Hannifin's recent surge suggests aggressive expansion or restructuring, Stanley Black & Decker's steadier path may reflect a focus on sustainable growth. As we look to 2024, the absence of data for Stanley Black & Decker invites speculation on their next strategic move.
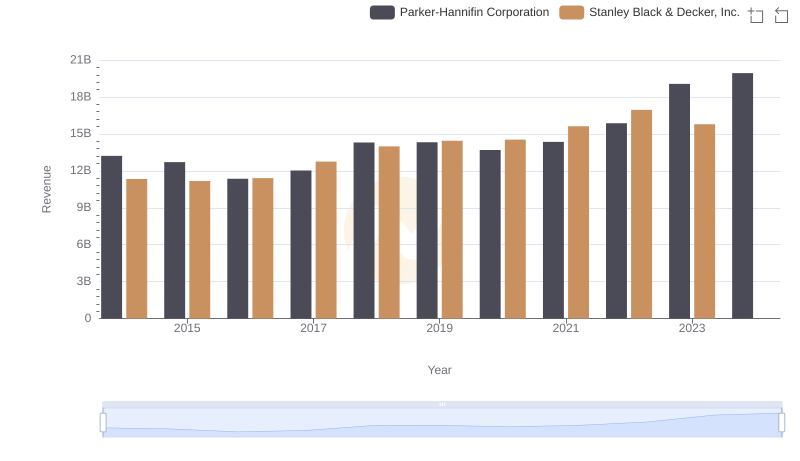
Parker-Hannifin Corporation and Stanley Black & Decker, Inc.: A Comprehensive Revenue Analysis

Cost of Revenue Trends: Parker-Hannifin Corporation vs Stanley Black & Decker, Inc.

Parker-Hannifin Corporation and Stanley Black & Decker, Inc.: A Detailed Gross Profit Analysis

Research and Development Expenses Breakdown: Parker-Hannifin Corporation vs Stanley Black & Decker, Inc.
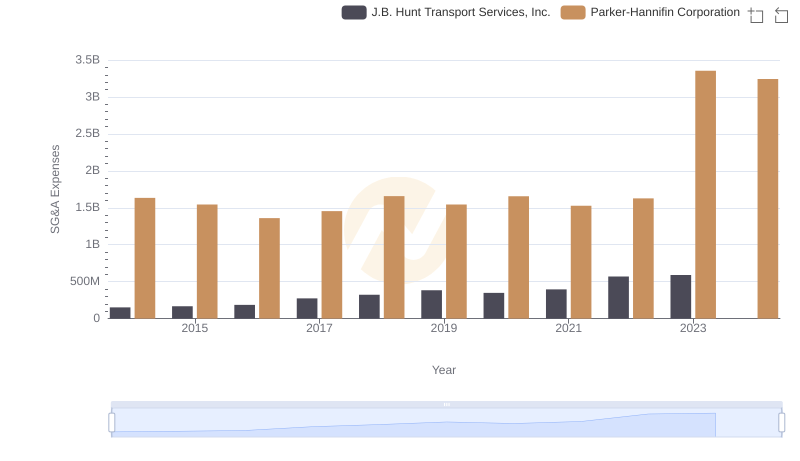
Breaking Down SG&A Expenses: Parker-Hannifin Corporation vs J.B. Hunt Transport Services, Inc.
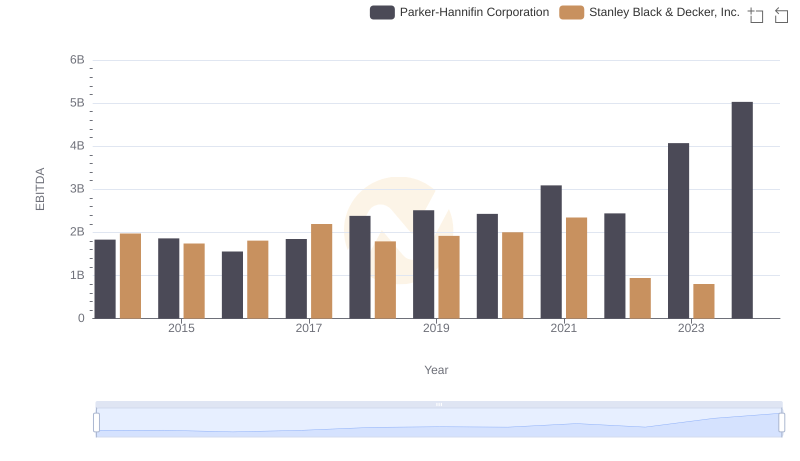
Comparative EBITDA Analysis: Parker-Hannifin Corporation vs Stanley Black & Decker, Inc.

Parker-Hannifin Corporation and Stanley Black & Decker, Inc.: A Comprehensive Revenue Analysis
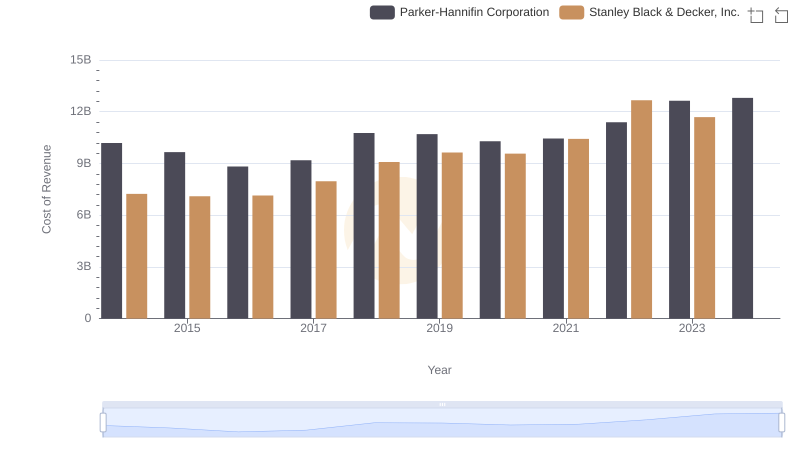
Analyzing Cost of Revenue: Parker-Hannifin Corporation and Stanley Black & Decker, Inc.
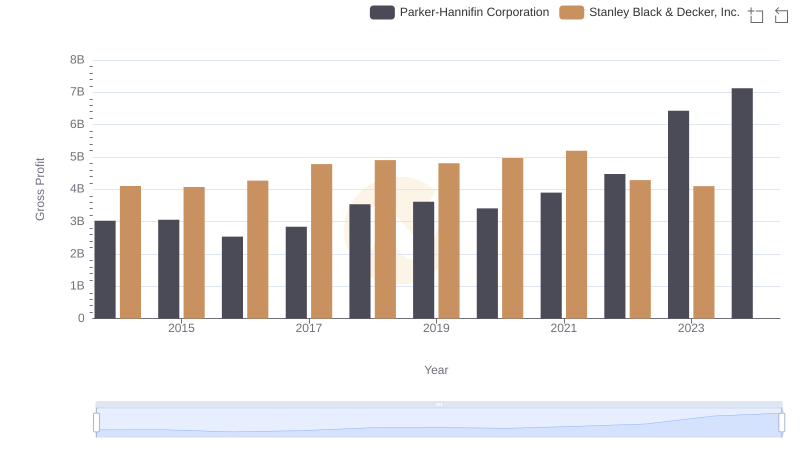
Gross Profit Comparison: Parker-Hannifin Corporation and Stanley Black & Decker, Inc. Trends
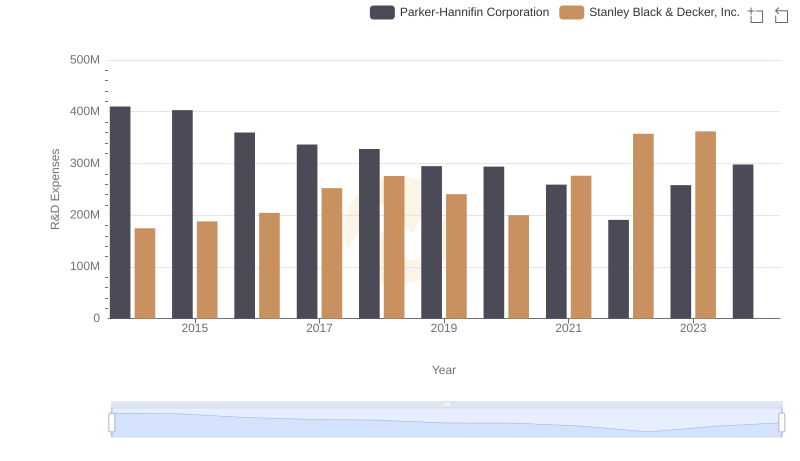
Parker-Hannifin Corporation or Stanley Black & Decker, Inc.: Who Invests More in Innovation?

Parker-Hannifin Corporation vs Stanley Black & Decker, Inc.: In-Depth EBITDA Performance Comparison