| __timestamp | Parker-Hannifin Corporation | Snap-on Incorporated |
|---|---|---|
| Wednesday, January 1, 2014 | 3027744000 | 1584300000 |
| Thursday, January 1, 2015 | 3056499000 | 1648300000 |
| Friday, January 1, 2016 | 2537369000 | 1709600000 |
| Sunday, January 1, 2017 | 2840350000 | 1824900000 |
| Monday, January 1, 2018 | 3539551000 | 1870000000 |
| Tuesday, January 1, 2019 | 3616840000 | 1844000000 |
| Wednesday, January 1, 2020 | 3409002000 | 1748500000 |
| Friday, January 1, 2021 | 3897960000 | 2110800000 |
| Saturday, January 1, 2022 | 4474341000 | 2181100000 |
| Sunday, January 1, 2023 | 6429302000 | 2619800000 |
| Monday, January 1, 2024 | 7127790000 | 2377900000 |
In pursuit of knowledge
In the ever-evolving landscape of industrial manufacturing, Parker-Hannifin Corporation and Snap-on Incorporated have carved out significant niches. Over the past decade, Parker-Hannifin has demonstrated a robust growth trajectory, with its gross profit surging by approximately 135% from 2014 to 2023. This impressive growth is highlighted by a remarkable leap in 2023, where gross profit reached a peak of $7.1 billion, a 60% increase from the previous year.
Conversely, Snap-on Incorporated has shown steady, albeit more modest, growth. From 2014 to 2023, Snap-on's gross profit increased by around 65%, peaking at $2.6 billion in 2023. This consistent upward trend underscores Snap-on's resilience in a competitive market.
While Parker-Hannifin's data for 2024 is available, Snap-on's figures remain elusive, leaving room for speculation on its future performance. This comparison offers a fascinating glimpse into the dynamics of industrial profitability.
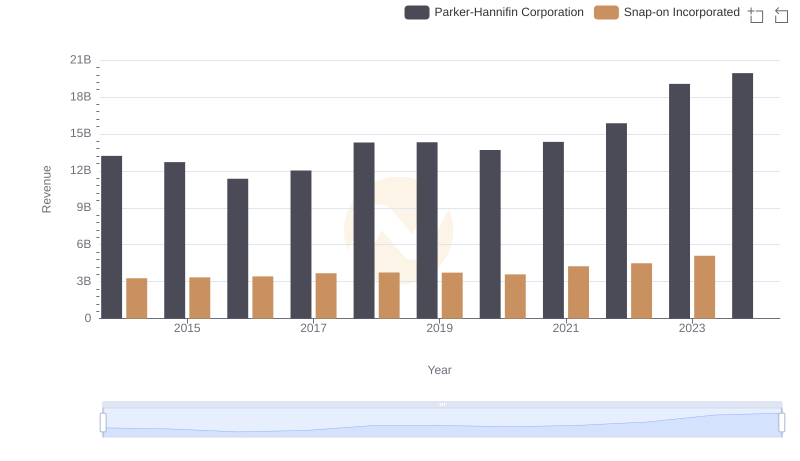
Revenue Showdown: Parker-Hannifin Corporation vs Snap-on Incorporated
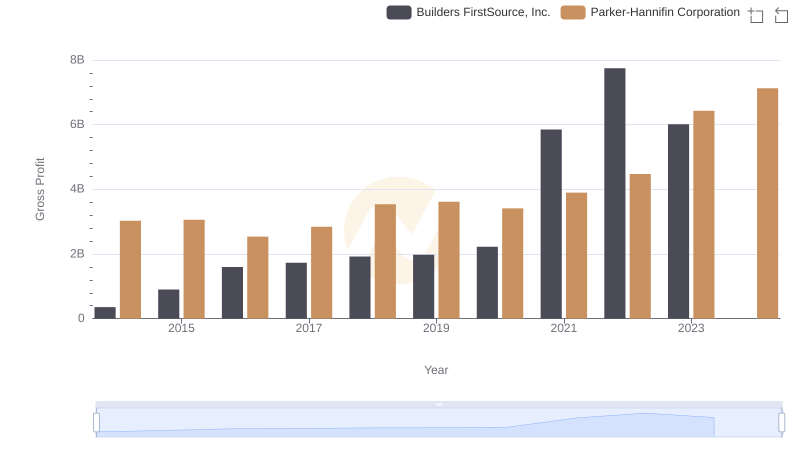
Parker-Hannifin Corporation and Builders FirstSource, Inc.: A Detailed Gross Profit Analysis
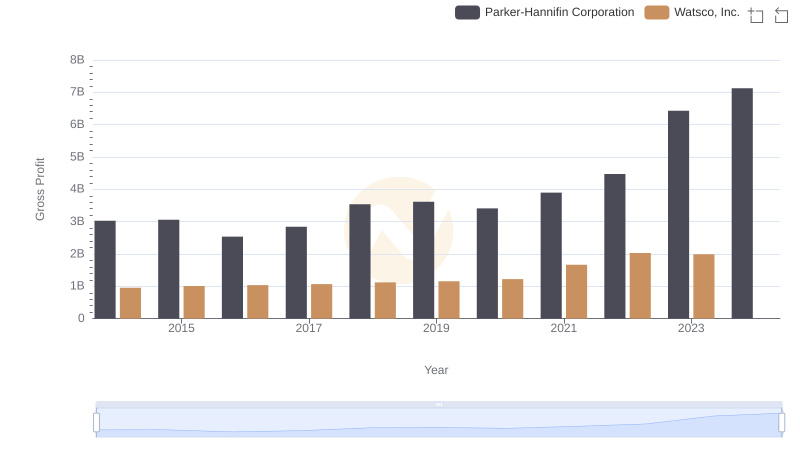
Gross Profit Comparison: Parker-Hannifin Corporation and Watsco, Inc. Trends
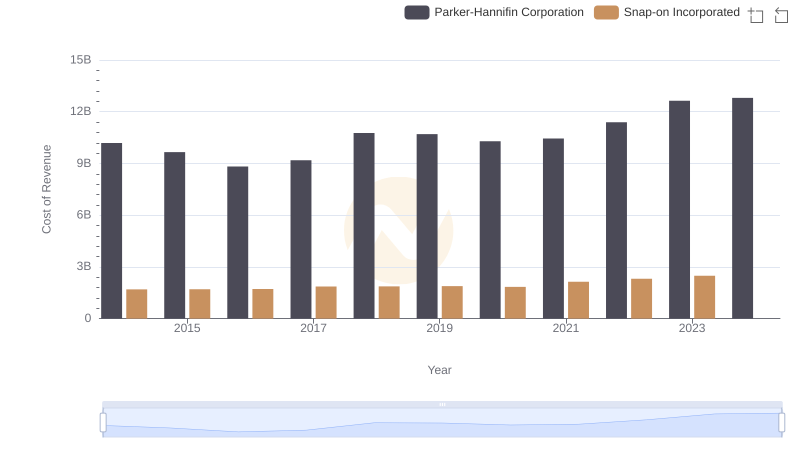
Analyzing Cost of Revenue: Parker-Hannifin Corporation and Snap-on Incorporated
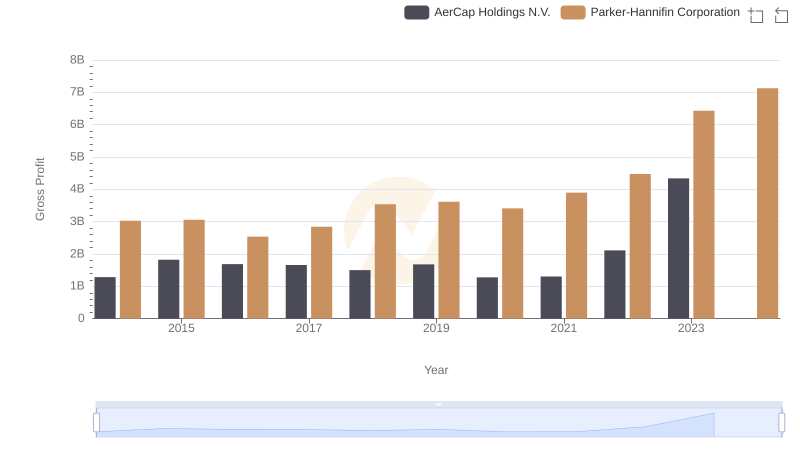
Gross Profit Trends Compared: Parker-Hannifin Corporation vs AerCap Holdings N.V.
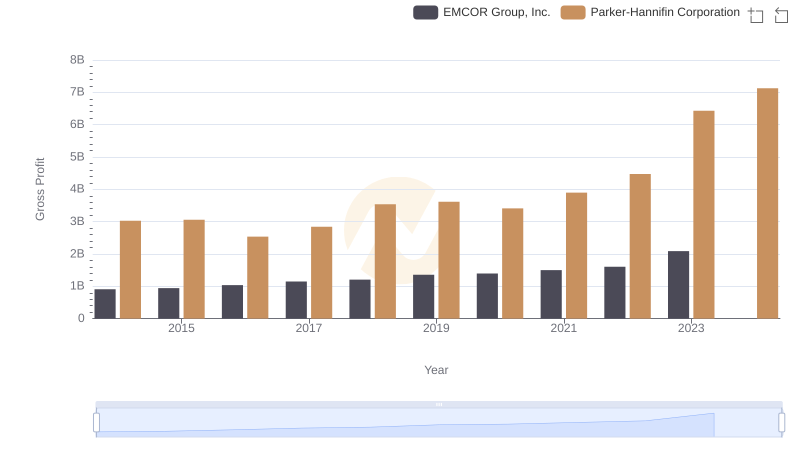
Who Generates Higher Gross Profit? Parker-Hannifin Corporation or EMCOR Group, Inc.
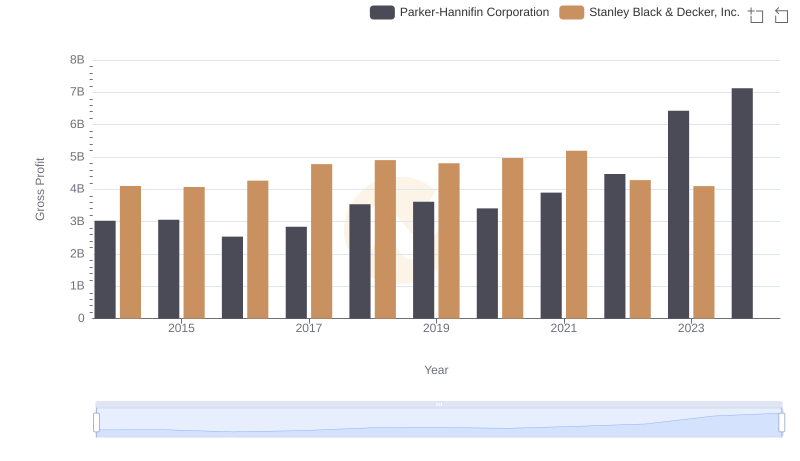
Parker-Hannifin Corporation and Stanley Black & Decker, Inc.: A Detailed Gross Profit Analysis
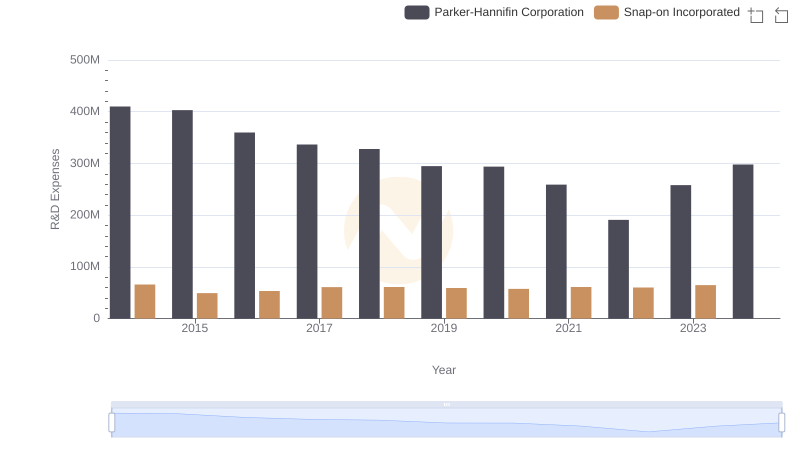
Research and Development Expenses Breakdown: Parker-Hannifin Corporation vs Snap-on Incorporated
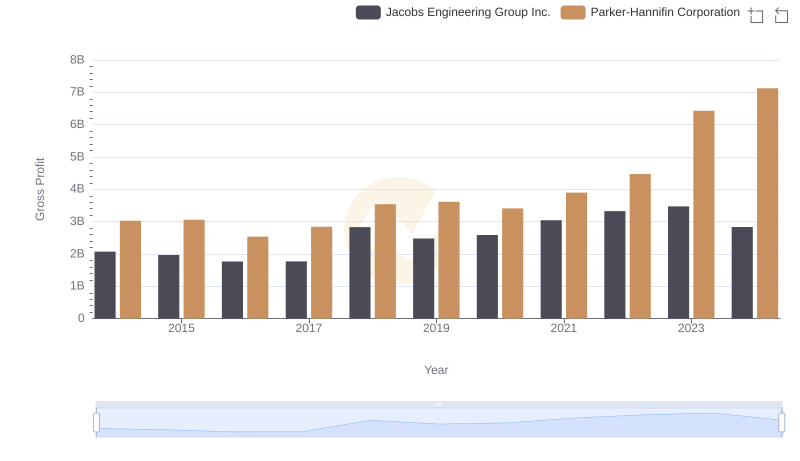
Key Insights on Gross Profit: Parker-Hannifin Corporation vs Jacobs Engineering Group Inc.
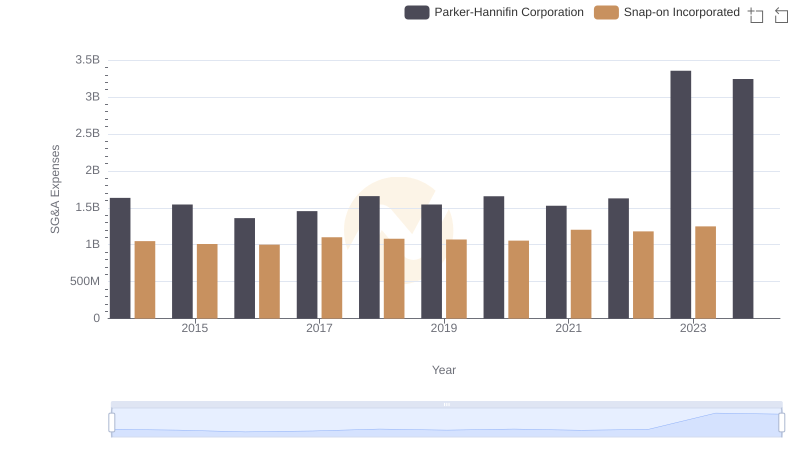
SG&A Efficiency Analysis: Comparing Parker-Hannifin Corporation and Snap-on Incorporated
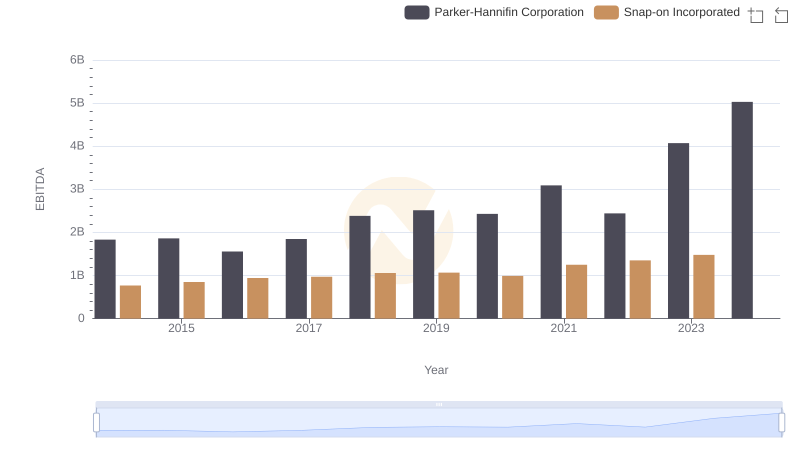
EBITDA Performance Review: Parker-Hannifin Corporation vs Snap-on Incorporated