| __timestamp | Jacobs Engineering Group Inc. | Parker-Hannifin Corporation |
|---|---|---|
| Wednesday, January 1, 2014 | 1545716000 | 1633992000 |
| Thursday, January 1, 2015 | 1522811000 | 1544746000 |
| Friday, January 1, 2016 | 1429233000 | 1359360000 |
| Sunday, January 1, 2017 | 1379983000 | 1453935000 |
| Monday, January 1, 2018 | 2180399000 | 1657152000 |
| Tuesday, January 1, 2019 | 2072177000 | 1543939000 |
| Wednesday, January 1, 2020 | 2050695000 | 1656553000 |
| Friday, January 1, 2021 | 2355683000 | 1527302000 |
| Saturday, January 1, 2022 | 2409190000 | 1627116000 |
| Sunday, January 1, 2023 | 2398078000 | 3354103000 |
| Monday, January 1, 2024 | 2140320000 | 3315177000 |
Unleashing insights
In the ever-evolving landscape of industrial giants, understanding the financial dynamics of companies like Parker-Hannifin Corporation and Jacobs Engineering Group Inc. is crucial. Over the past decade, from 2014 to 2024, these two companies have shown distinct trends in their Selling, General, and Administrative (SG&A) expenses.
Parker-Hannifin, a leader in motion and control technologies, saw a significant spike in 2023, with SG&A expenses soaring by over 100% compared to the previous year. This surge highlights strategic investments or operational expansions. Meanwhile, Jacobs Engineering, a global provider of technical services, maintained a steady increase, peaking in 2022 with a 25% rise from 2018.
These trends reflect broader industry shifts and strategic priorities, offering valuable insights for investors and industry analysts alike.
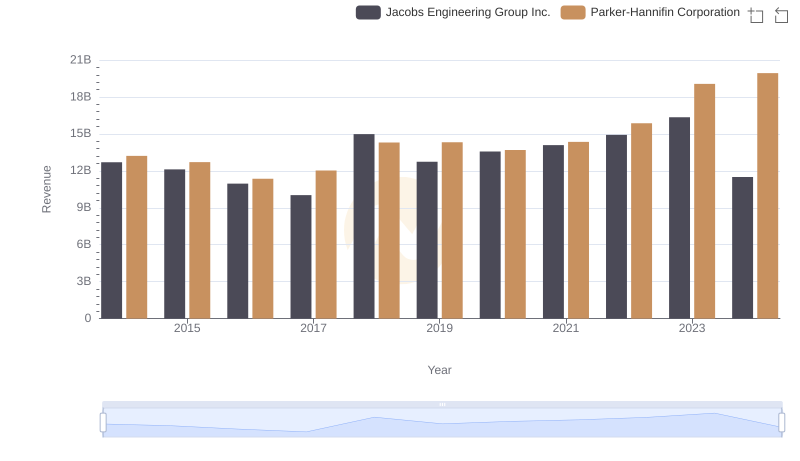
Parker-Hannifin Corporation or Jacobs Engineering Group Inc.: Who Leads in Yearly Revenue?
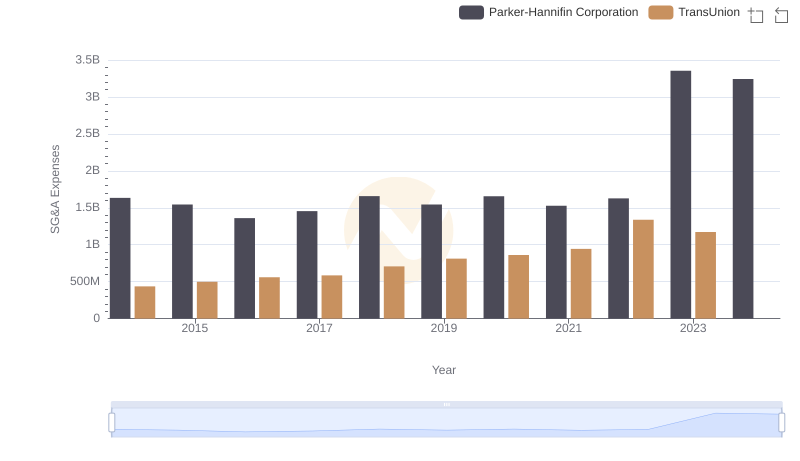
Selling, General, and Administrative Costs: Parker-Hannifin Corporation vs TransUnion
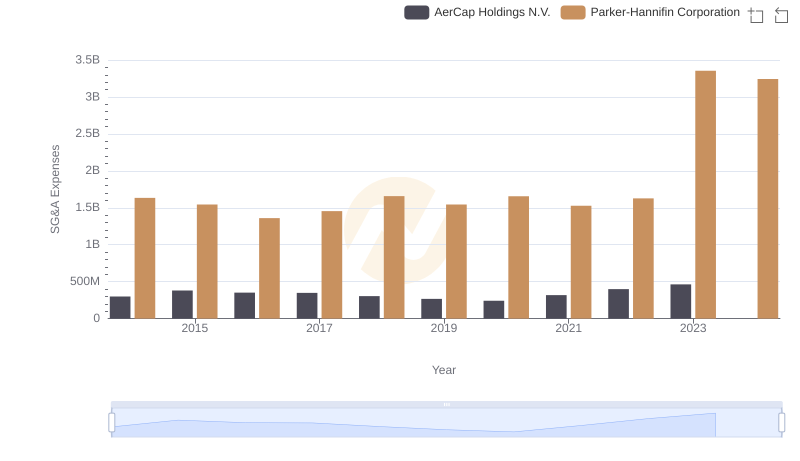
Who Optimizes SG&A Costs Better? Parker-Hannifin Corporation or AerCap Holdings N.V.
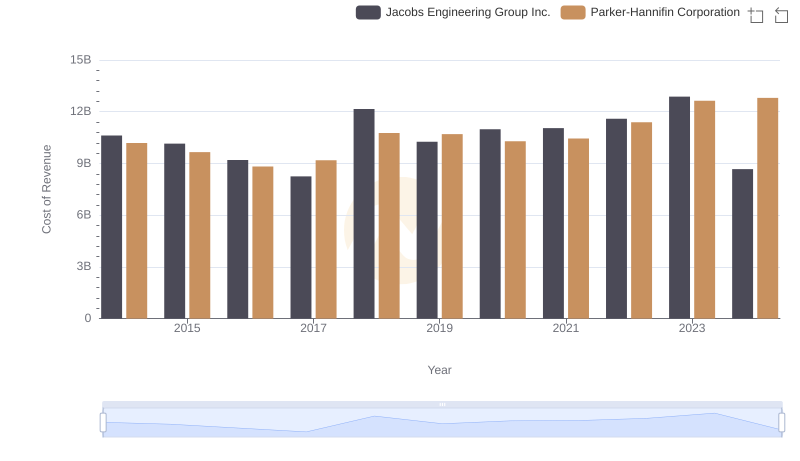
Parker-Hannifin Corporation vs Jacobs Engineering Group Inc.: Efficiency in Cost of Revenue Explored
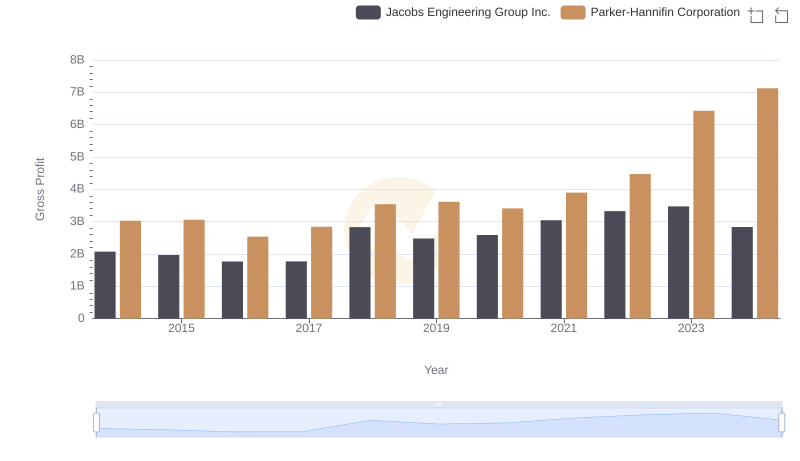
Key Insights on Gross Profit: Parker-Hannifin Corporation vs Jacobs Engineering Group Inc.
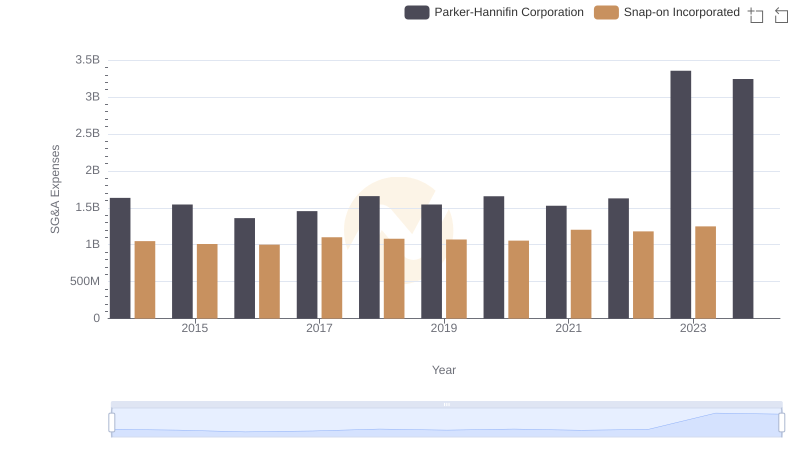
SG&A Efficiency Analysis: Comparing Parker-Hannifin Corporation and Snap-on Incorporated
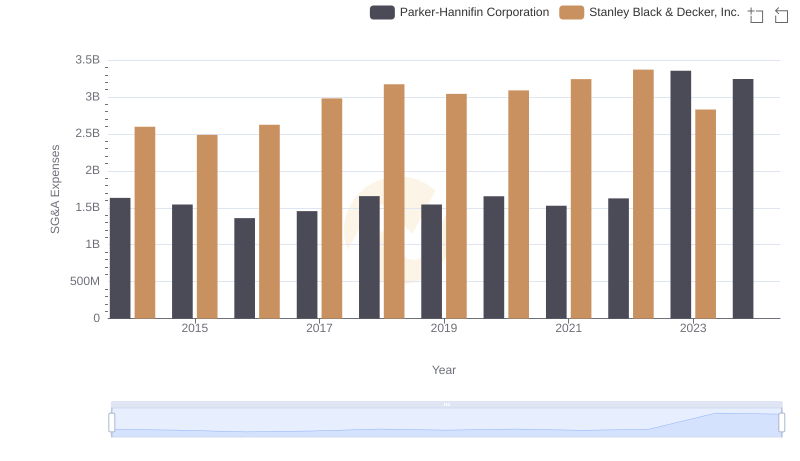
Operational Costs Compared: SG&A Analysis of Parker-Hannifin Corporation and Stanley Black & Decker, Inc.
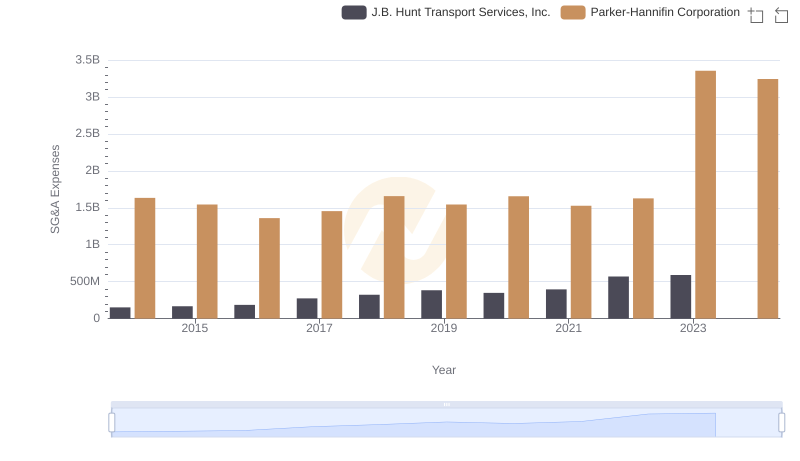
Breaking Down SG&A Expenses: Parker-Hannifin Corporation vs J.B. Hunt Transport Services, Inc.
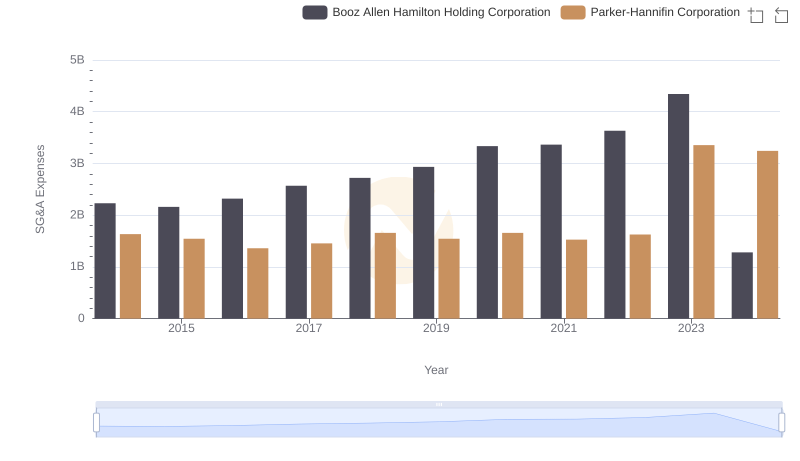
Breaking Down SG&A Expenses: Parker-Hannifin Corporation vs Booz Allen Hamilton Holding Corporation
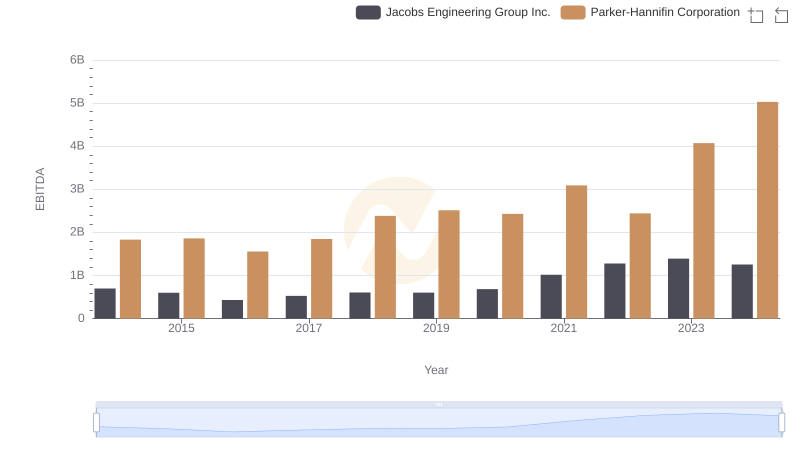
EBITDA Metrics Evaluated: Parker-Hannifin Corporation vs Jacobs Engineering Group Inc.