| __timestamp | HubSpot, Inc. | International Business Machines Corporation |
|---|---|---|
| Wednesday, January 1, 2014 | 101767000 | 22472000000 |
| Thursday, January 1, 2015 | 148037000 | 19894000000 |
| Friday, January 1, 2016 | 207767000 | 20279000000 |
| Sunday, January 1, 2017 | 269646000 | 19680000000 |
| Monday, January 1, 2018 | 343278000 | 19366000000 |
| Tuesday, January 1, 2019 | 433656000 | 18724000000 |
| Wednesday, January 1, 2020 | 561306000 | 20561000000 |
| Friday, January 1, 2021 | 794630000 | 18745000000 |
| Saturday, January 1, 2022 | 1083789000 | 17483000000 |
| Sunday, January 1, 2023 | 1318209000 | 17997000000 |
| Monday, January 1, 2024 | 1519176000 | 29536000000 |
Cracking the code
In the ever-evolving landscape of corporate finance, understanding the efficiency of Selling, General, and Administrative (SG&A) expenses is crucial. This analysis juxtaposes the SG&A efficiency of two industry giants: International Business Machines Corporation (IBM) and HubSpot, Inc., from 2014 to 2023.
IBM, a stalwart in the tech industry, maintained a consistent SG&A expense, averaging around $20 billion annually. Despite fluctuations, IBM's expenses reflect a stable operational strategy, with a slight decrease of about 20% over the decade.
Conversely, HubSpot, a leader in inbound marketing, exhibited a dynamic growth trajectory. Starting with SG&A expenses of approximately $100 million in 2014, HubSpot's expenses surged by over 1,200% to $1.3 billion by 2023. This growth underscores HubSpot's aggressive expansion and investment in scaling operations.
This comparative analysis highlights the contrasting strategies of IBM and HubSpot, offering insights into their operational efficiencies and market positioning.
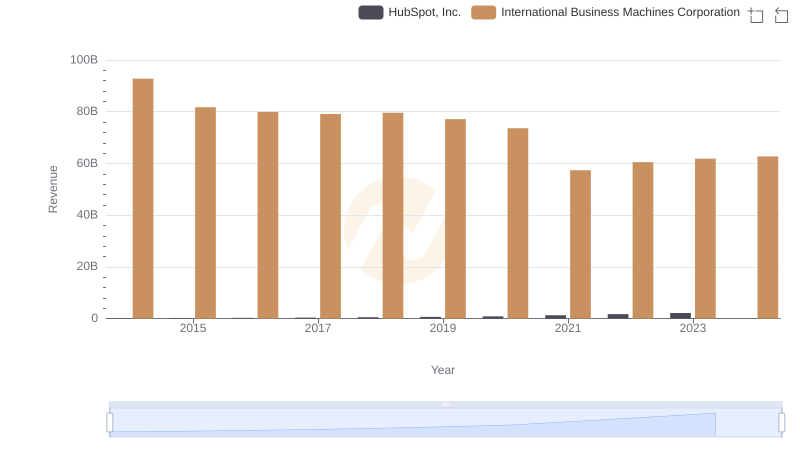
Who Generates More Revenue? International Business Machines Corporation or HubSpot, Inc.
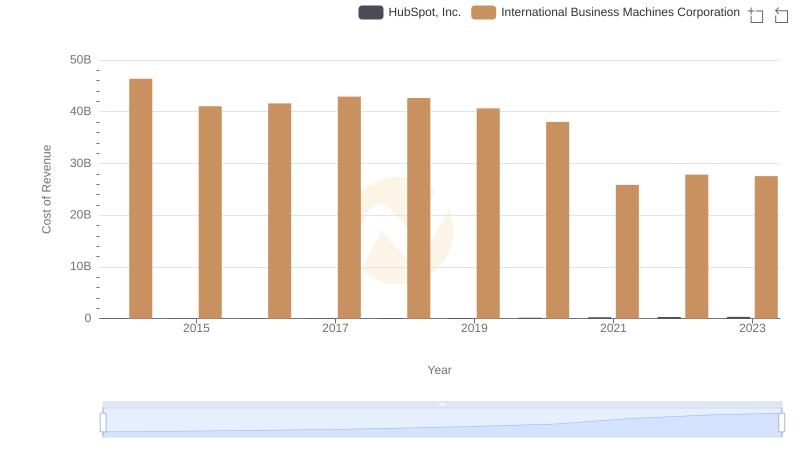
Cost of Revenue Trends: International Business Machines Corporation vs HubSpot, Inc.
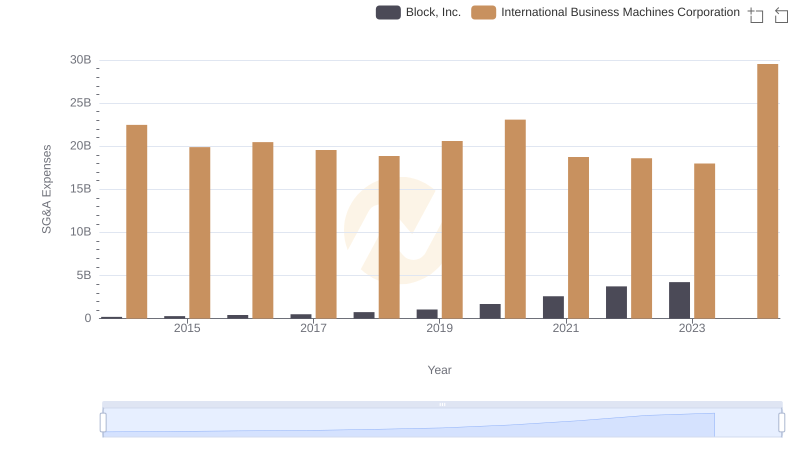
International Business Machines Corporation vs Block, Inc.: SG&A Expense Trends
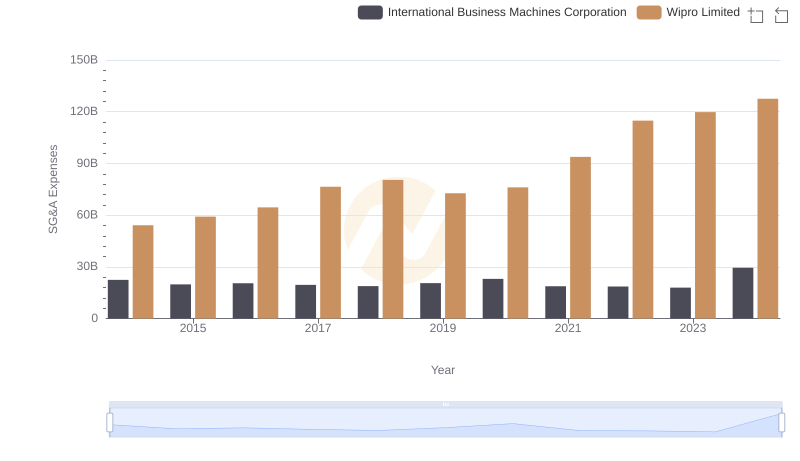
Selling, General, and Administrative Costs: International Business Machines Corporation vs Wipro Limited
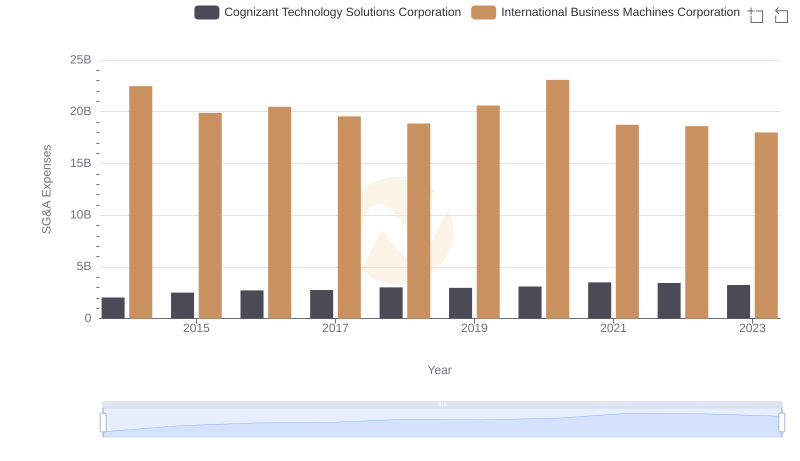
Who Optimizes SG&A Costs Better? International Business Machines Corporation or Cognizant Technology Solutions Corporation
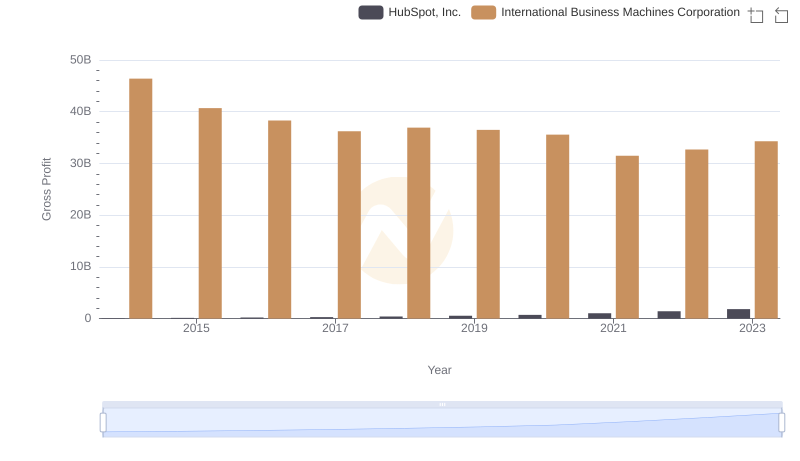
Gross Profit Trends Compared: International Business Machines Corporation vs HubSpot, Inc.
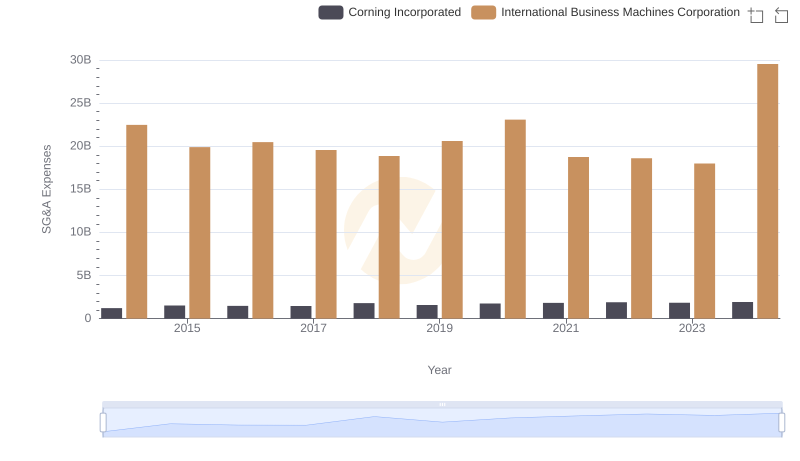
Selling, General, and Administrative Costs: International Business Machines Corporation vs Corning Incorporated
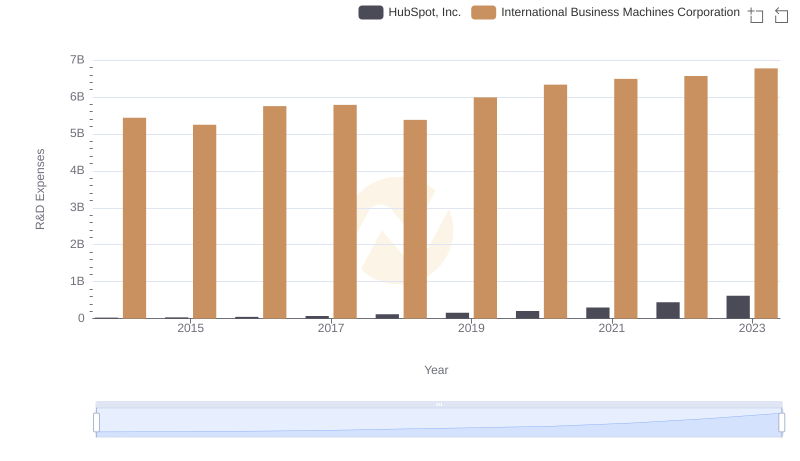
International Business Machines Corporation vs HubSpot, Inc.: Strategic Focus on R&D Spending
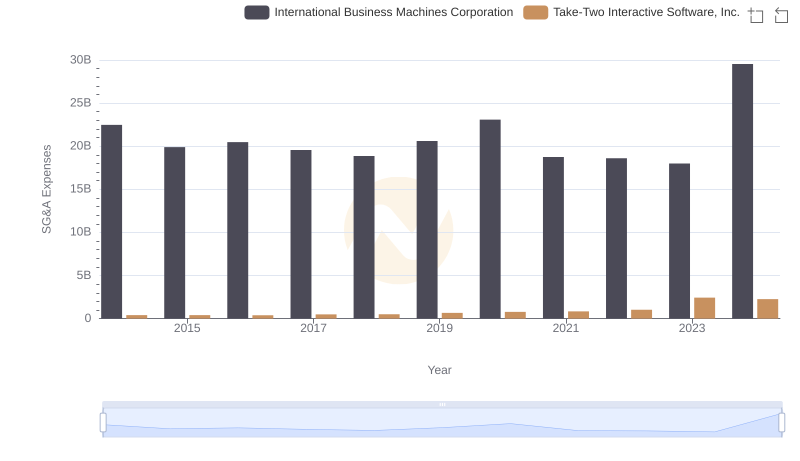
Who Optimizes SG&A Costs Better? International Business Machines Corporation or Take-Two Interactive Software, Inc.
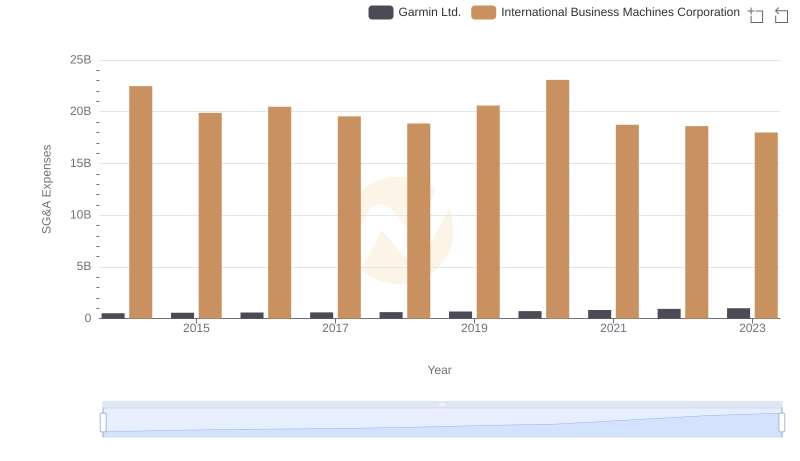
Operational Costs Compared: SG&A Analysis of International Business Machines Corporation and Garmin Ltd.
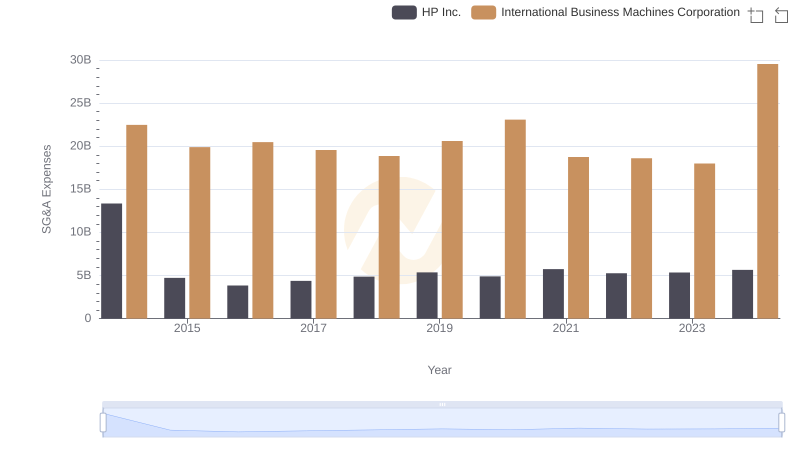
Breaking Down SG&A Expenses: International Business Machines Corporation vs HP Inc.
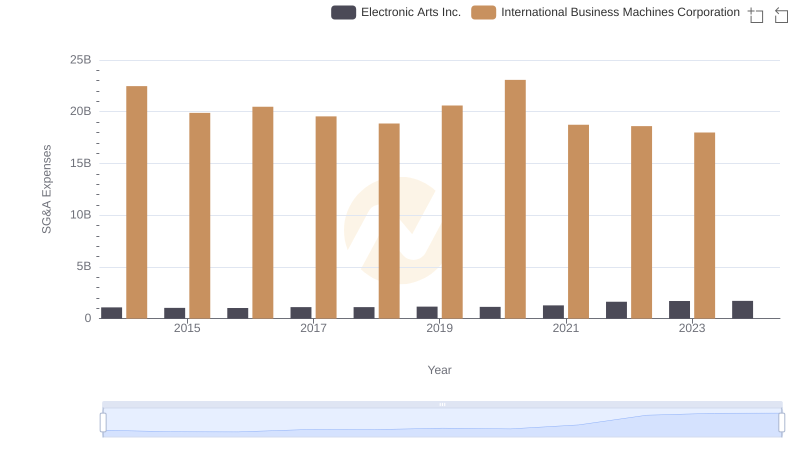
International Business Machines Corporation or Electronic Arts Inc.: Who Manages SG&A Costs Better?