| __timestamp | HubSpot, Inc. | International Business Machines Corporation |
|---|---|---|
| Wednesday, January 1, 2014 | 78796000 | 46407000000 |
| Thursday, January 1, 2015 | 134020000 | 40684000000 |
| Friday, January 1, 2016 | 209102000 | 38516000000 |
| Sunday, January 1, 2017 | 299883000 | 36943000000 |
| Monday, January 1, 2018 | 412623000 | 36936000000 |
| Tuesday, January 1, 2019 | 544902000 | 31533000000 |
| Wednesday, January 1, 2020 | 716067000 | 30865000000 |
| Friday, January 1, 2021 | 1041801000 | 31486000000 |
| Saturday, January 1, 2022 | 1416710000 | 32687000000 |
| Sunday, January 1, 2023 | 1824741000 | 34300000000 |
| Monday, January 1, 2024 | 2234278000 | 35551000000 |
Igniting the spark of knowledge
In the ever-evolving landscape of technology, the financial trajectories of International Business Machines Corporation (IBM) and HubSpot, Inc. offer a fascinating study in contrasts. Over the past decade, IBM, a stalwart in the tech industry, has seen its gross profit fluctuate, peaking in 2014 and experiencing a gradual decline thereafter. Despite this, IBM's gross profit remains robust, averaging around $36 billion annually.
Conversely, HubSpot, a relative newcomer, has demonstrated impressive growth. From a modest $79 million in 2014, HubSpot's gross profit has surged by over 2,200%, reaching approximately $1.8 billion in 2023. This meteoric rise underscores the dynamic nature of the tech sector, where innovation and adaptability are key.
While IBM's figures dwarf those of HubSpot, the latter's rapid growth trajectory highlights the potential for disruption in the industry. As we look to the future, the question remains: will HubSpot continue its upward trend, or will IBM reclaim its former glory?
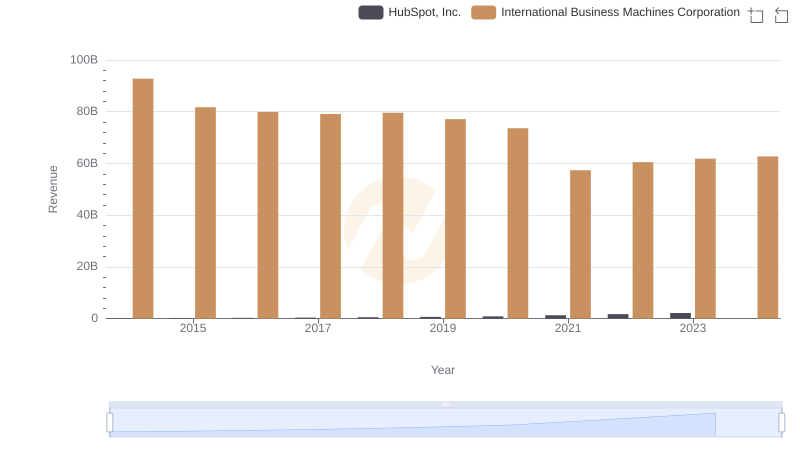
Who Generates More Revenue? International Business Machines Corporation or HubSpot, Inc.
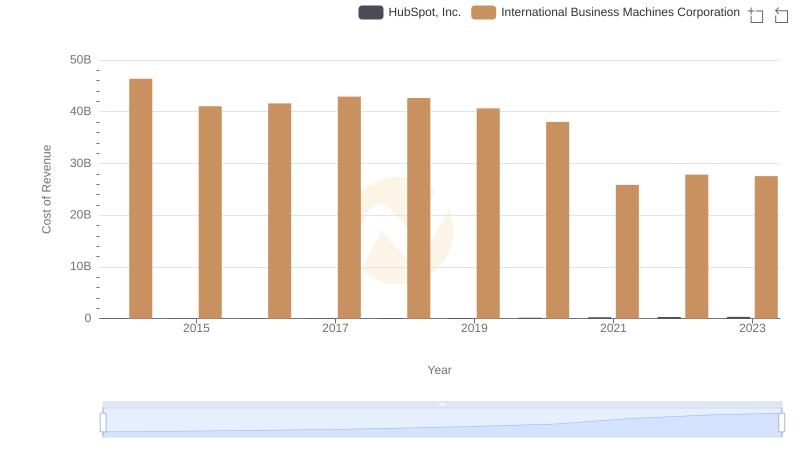
Cost of Revenue Trends: International Business Machines Corporation vs HubSpot, Inc.
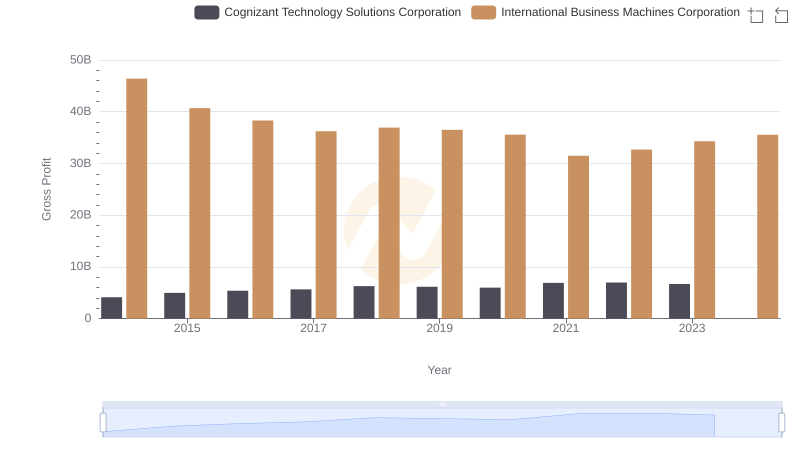
International Business Machines Corporation vs Cognizant Technology Solutions Corporation: A Gross Profit Performance Breakdown
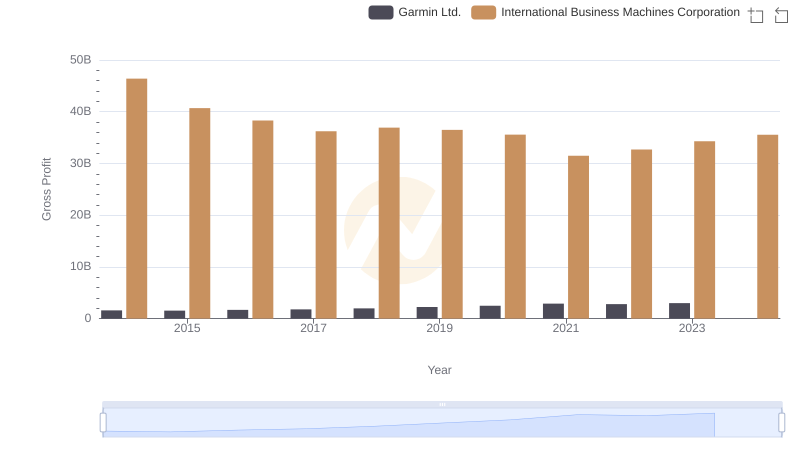
Gross Profit Trends Compared: International Business Machines Corporation vs Garmin Ltd.
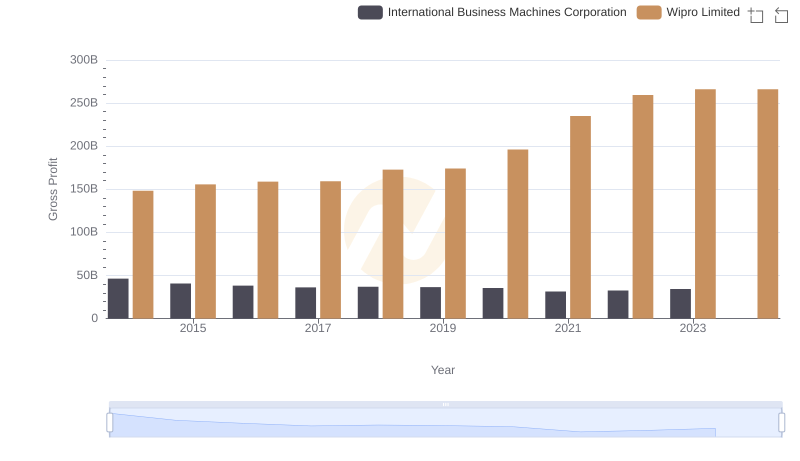
Who Generates Higher Gross Profit? International Business Machines Corporation or Wipro Limited

International Business Machines Corporation and Take-Two Interactive Software, Inc.: A Detailed Gross Profit Analysis
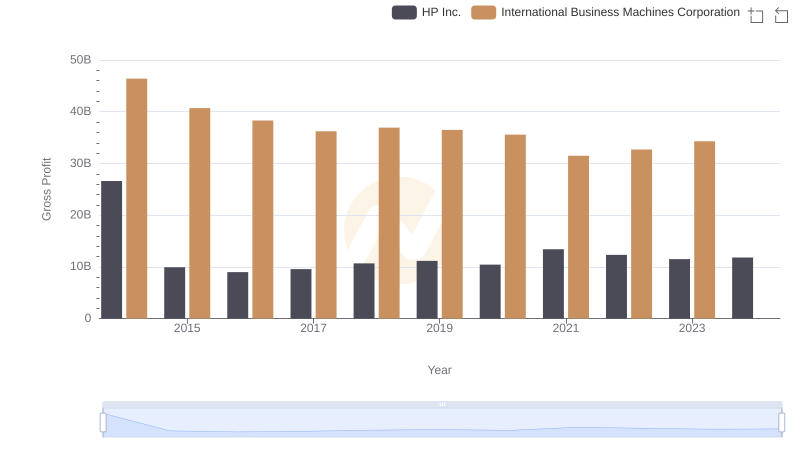
Key Insights on Gross Profit: International Business Machines Corporation vs HP Inc.
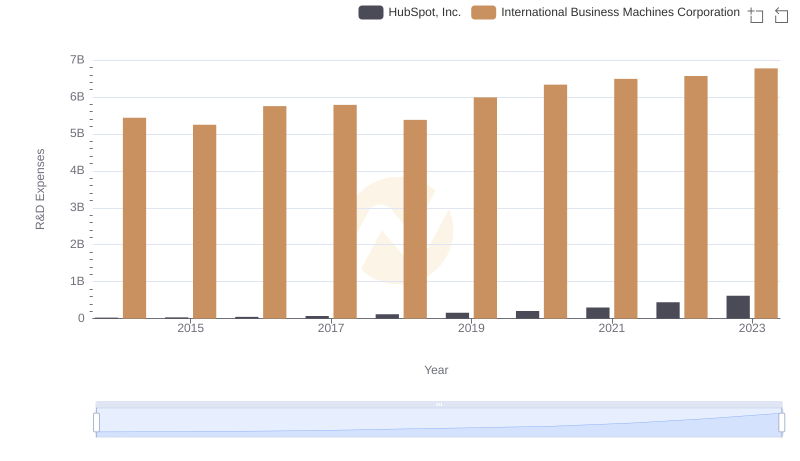
International Business Machines Corporation vs HubSpot, Inc.: Strategic Focus on R&D Spending
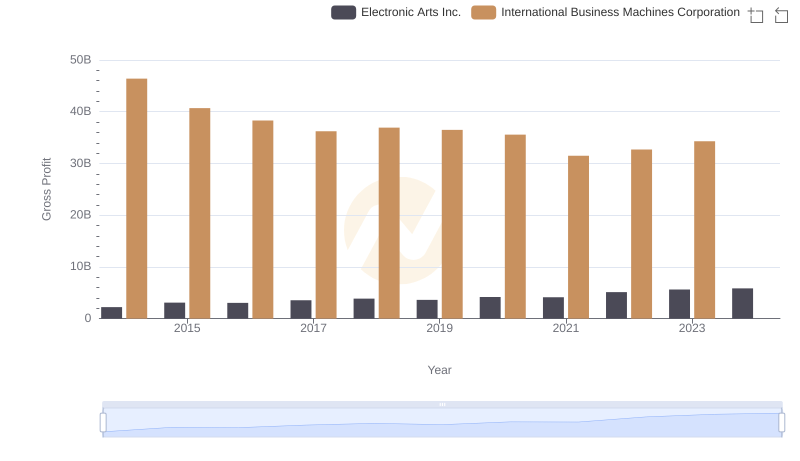
International Business Machines Corporation vs Electronic Arts Inc.: A Gross Profit Performance Breakdown
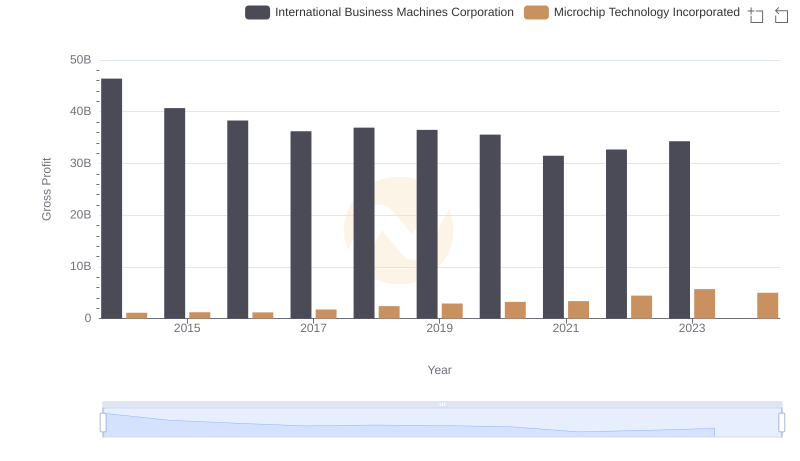
Gross Profit Analysis: Comparing International Business Machines Corporation and Microchip Technology Incorporated
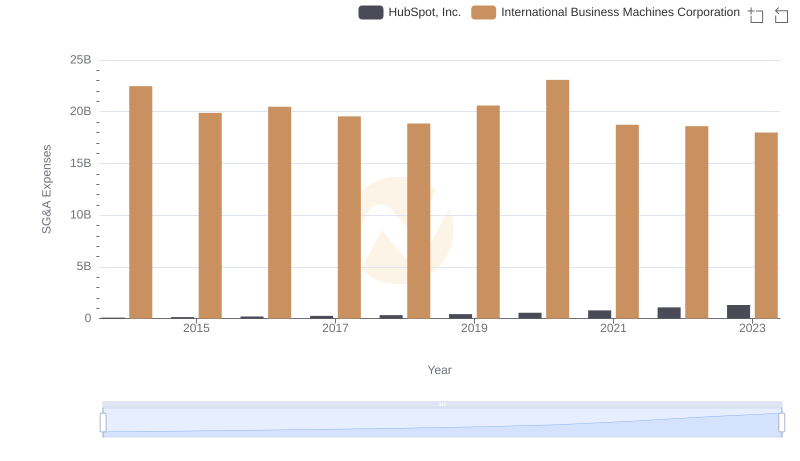
SG&A Efficiency Analysis: Comparing International Business Machines Corporation and HubSpot, Inc.
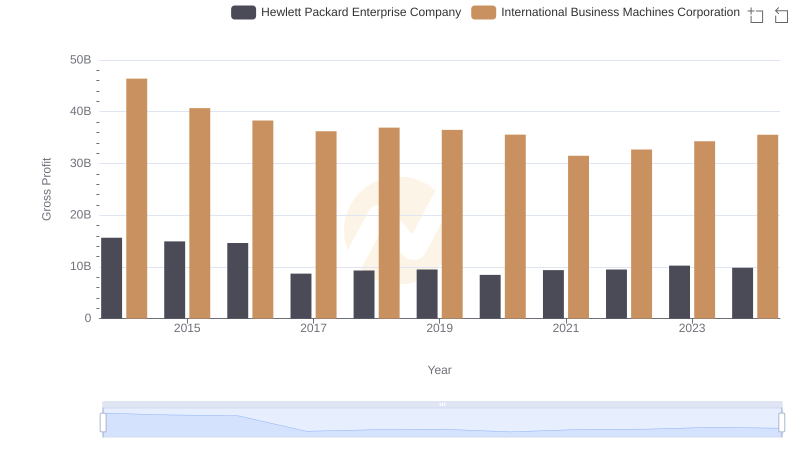
Gross Profit Analysis: Comparing International Business Machines Corporation and Hewlett Packard Enterprise Company