| __timestamp | HubSpot, Inc. | International Business Machines Corporation |
|---|---|---|
| Wednesday, January 1, 2014 | 37080000 | 46386000000 |
| Thursday, January 1, 2015 | 47923000 | 41057000000 |
| Friday, January 1, 2016 | 61865000 | 41403000000 |
| Sunday, January 1, 2017 | 75729000 | 42196000000 |
| Monday, January 1, 2018 | 100357000 | 42655000000 |
| Tuesday, January 1, 2019 | 129958000 | 26181000000 |
| Wednesday, January 1, 2020 | 166959000 | 24314000000 |
| Friday, January 1, 2021 | 258857000 | 25865000000 |
| Saturday, January 1, 2022 | 314259000 | 27842000000 |
| Sunday, January 1, 2023 | 345489000 | 27560000000 |
| Monday, January 1, 2024 | 393265000 | 27202000000 |
Infusing magic into the data realm
In the ever-evolving landscape of technology, the cost of revenue is a critical metric that reflects a company's operational efficiency. From 2014 to 2023, International Business Machines Corporation (IBM) and HubSpot, Inc. have showcased contrasting trends in their cost of revenue. IBM, a stalwart in the tech industry, saw its cost of revenue decrease by approximately 41% over the decade, from $46 billion in 2014 to $27.6 billion in 2023. This decline highlights IBM's strategic shift towards more efficient operations.
Conversely, HubSpot, a rising star in the software sector, experienced a staggering 830% increase in its cost of revenue, from $37 million in 2014 to $345 million in 2023. This growth underscores HubSpot's rapid expansion and investment in scaling its operations. Notably, data for 2024 is missing for HubSpot, indicating potential future developments. These trends offer a fascinating glimpse into the strategic priorities of these two tech titans.
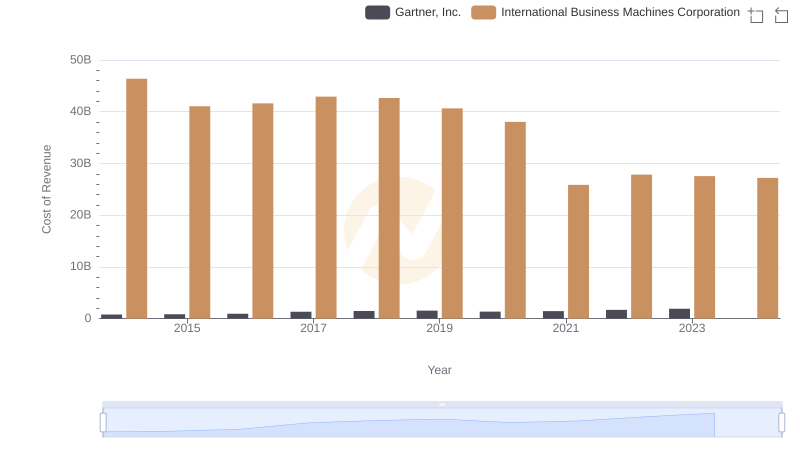
Cost Insights: Breaking Down International Business Machines Corporation and Gartner, Inc.'s Expenses
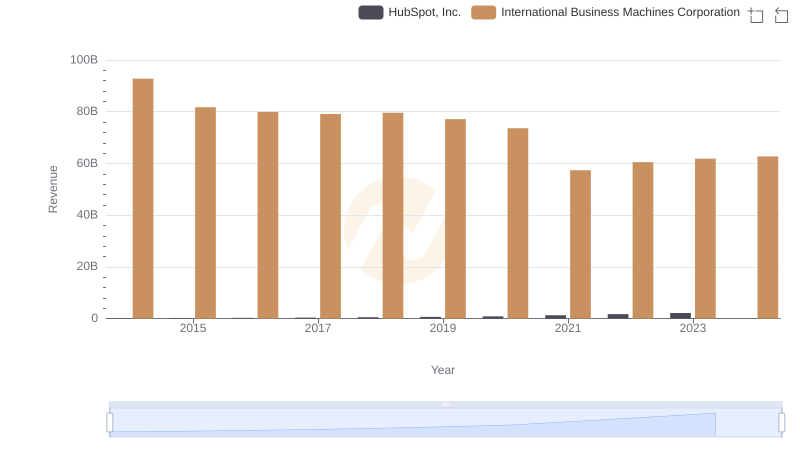
Who Generates More Revenue? International Business Machines Corporation or HubSpot, Inc.

Cost of Revenue Comparison: International Business Machines Corporation vs Garmin Ltd.
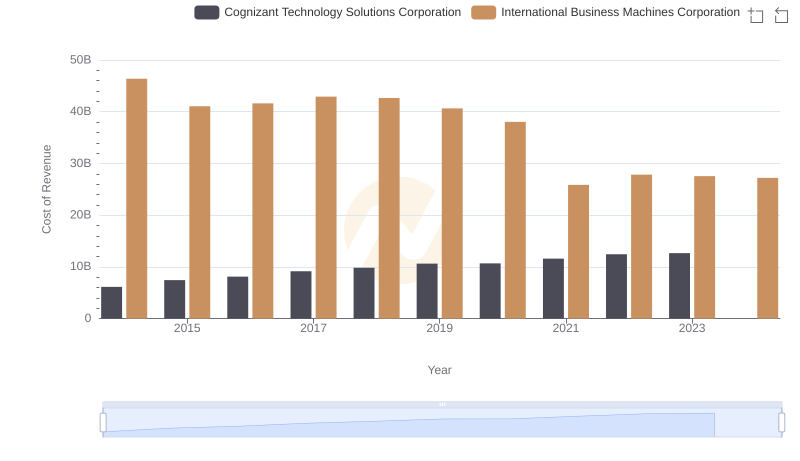
Analyzing Cost of Revenue: International Business Machines Corporation and Cognizant Technology Solutions Corporation
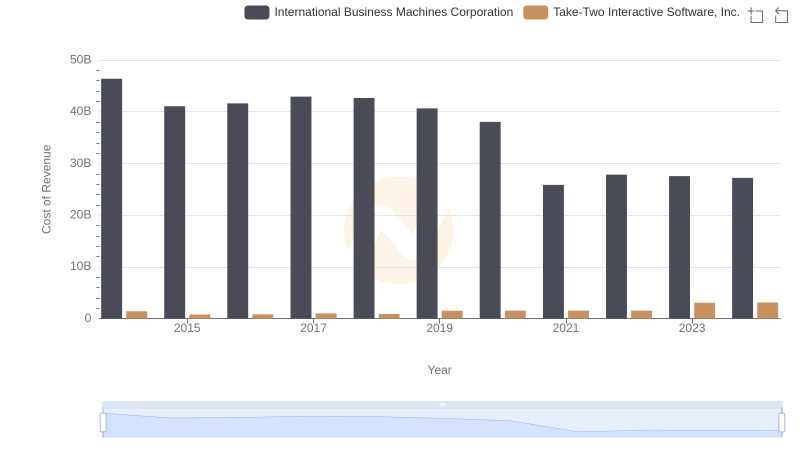
Cost of Revenue: Key Insights for International Business Machines Corporation and Take-Two Interactive Software, Inc.
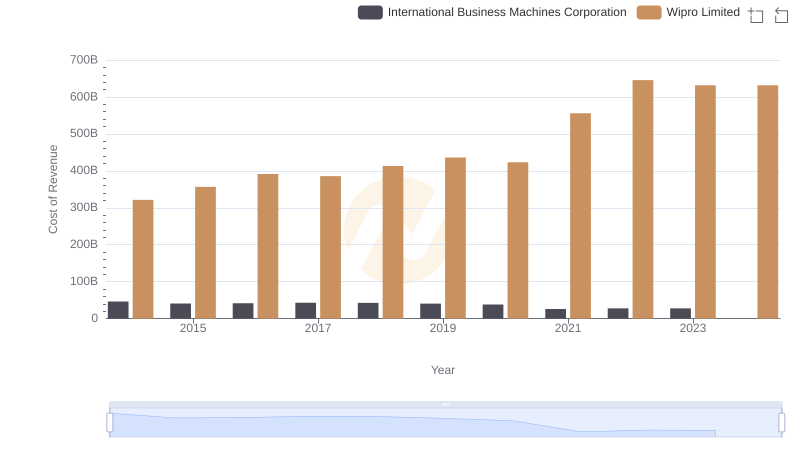
Analyzing Cost of Revenue: International Business Machines Corporation and Wipro Limited
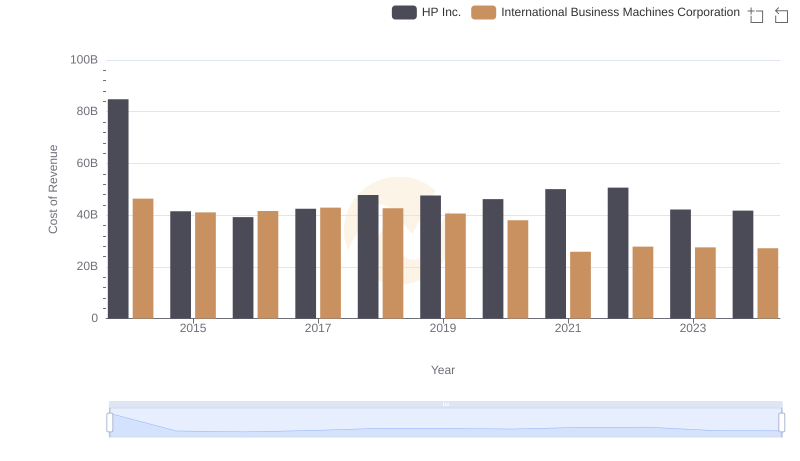
Cost of Revenue: Key Insights for International Business Machines Corporation and HP Inc.

Comparing Cost of Revenue Efficiency: International Business Machines Corporation vs Microchip Technology Incorporated
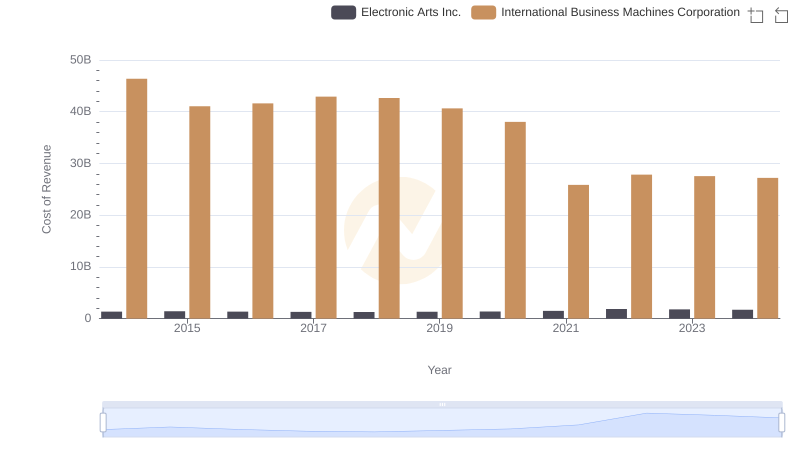
Comparing Cost of Revenue Efficiency: International Business Machines Corporation vs Electronic Arts Inc.
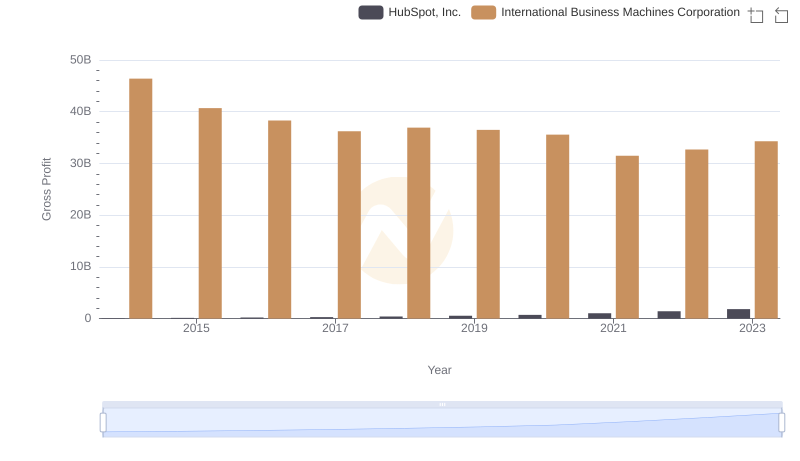
Gross Profit Trends Compared: International Business Machines Corporation vs HubSpot, Inc.
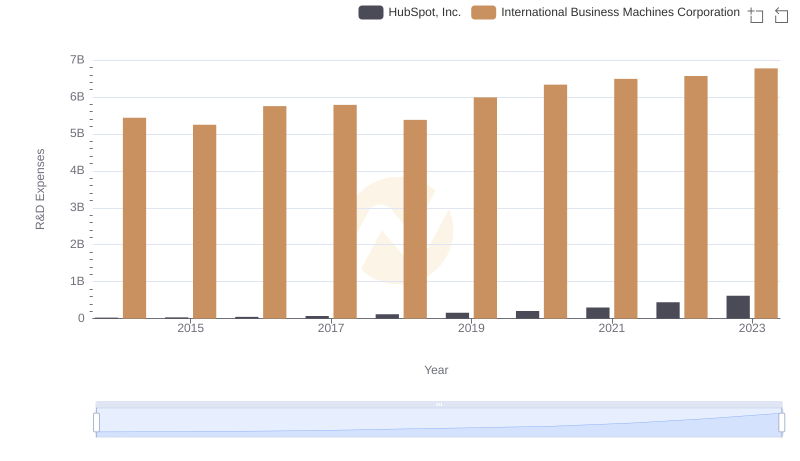
International Business Machines Corporation vs HubSpot, Inc.: Strategic Focus on R&D Spending
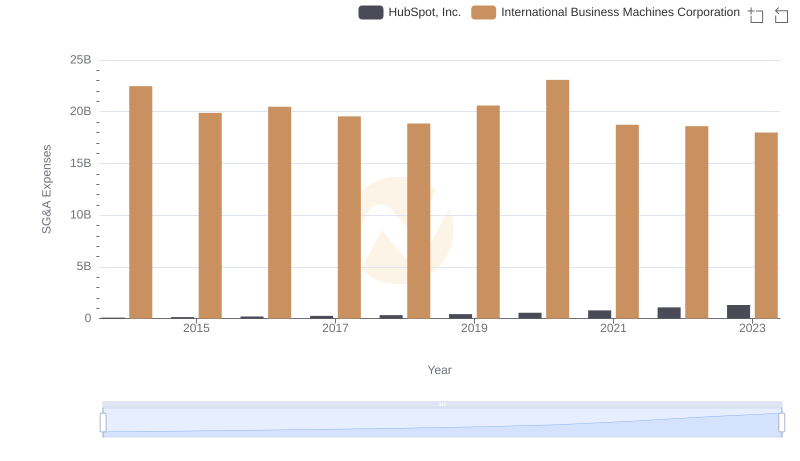
SG&A Efficiency Analysis: Comparing International Business Machines Corporation and HubSpot, Inc.