| __timestamp | Block, Inc. | International Business Machines Corporation |
|---|---|---|
| Wednesday, January 1, 2014 | 206797000 | 22472000000 |
| Thursday, January 1, 2015 | 289084000 | 19894000000 |
| Friday, January 1, 2016 | 425869000 | 20279000000 |
| Sunday, January 1, 2017 | 503723000 | 19680000000 |
| Monday, January 1, 2018 | 750396000 | 19366000000 |
| Tuesday, January 1, 2019 | 1061082000 | 18724000000 |
| Wednesday, January 1, 2020 | 1688873000 | 20561000000 |
| Friday, January 1, 2021 | 2600515000 | 18745000000 |
| Saturday, January 1, 2022 | 3744800000 | 17483000000 |
| Sunday, January 1, 2023 | 4228199000 | 17997000000 |
| Monday, January 1, 2024 | 29536000000 |
Cracking the code
In the ever-evolving landscape of corporate finance, understanding the trends in Selling, General, and Administrative (SG&A) expenses is crucial for investors and analysts alike. Over the past decade, International Business Machines Corporation (IBM) and Block, Inc. have showcased contrasting trajectories in their SG&A expenditures.
From 2014 to 2023, IBM's SG&A expenses have remained relatively stable, averaging around $20 billion annually, with a slight dip in 2023. In contrast, Block, Inc. has experienced a dramatic increase, with expenses growing over 1,900% from 2014 to 2023. This surge reflects Block's aggressive expansion and scaling strategies.
Interestingly, while IBM's expenses peaked in 2024, Block's data for that year remains unavailable, leaving room for speculation. These trends highlight the differing strategic priorities of a tech giant and a fintech disruptor, offering valuable insights into their operational focuses.
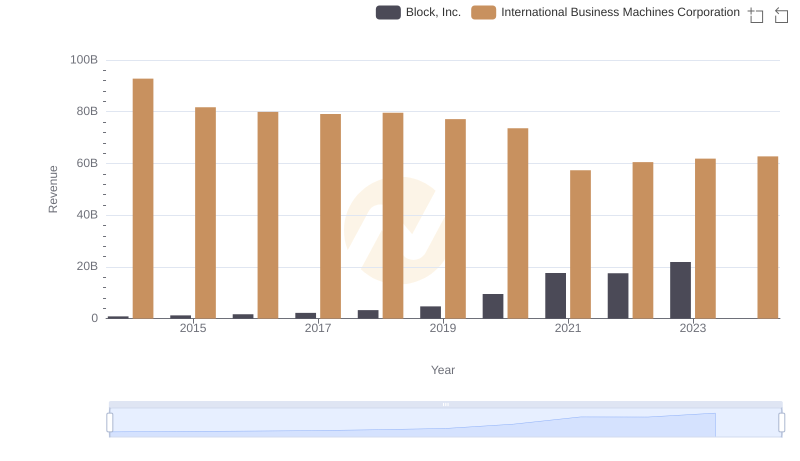
Who Generates More Revenue? International Business Machines Corporation or Block, Inc.
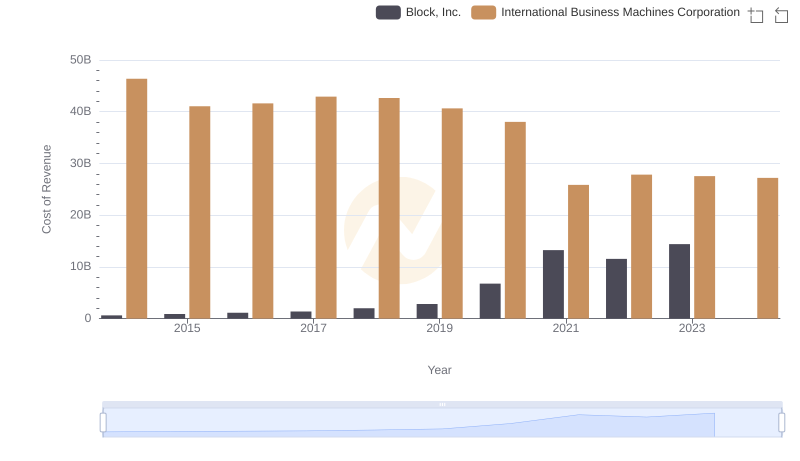
Cost Insights: Breaking Down International Business Machines Corporation and Block, Inc.'s Expenses
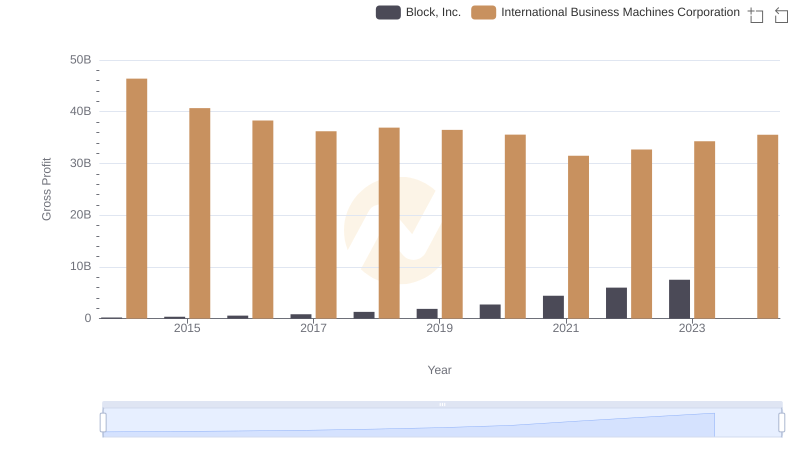
Who Generates Higher Gross Profit? International Business Machines Corporation or Block, Inc.
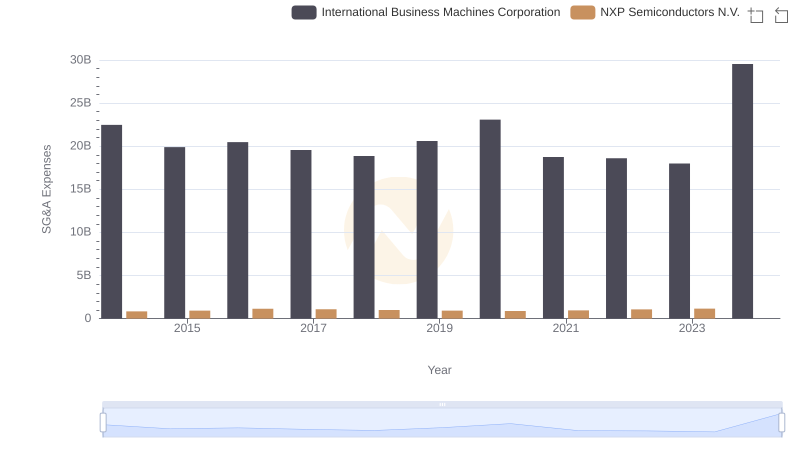
Selling, General, and Administrative Costs: International Business Machines Corporation vs NXP Semiconductors N.V.
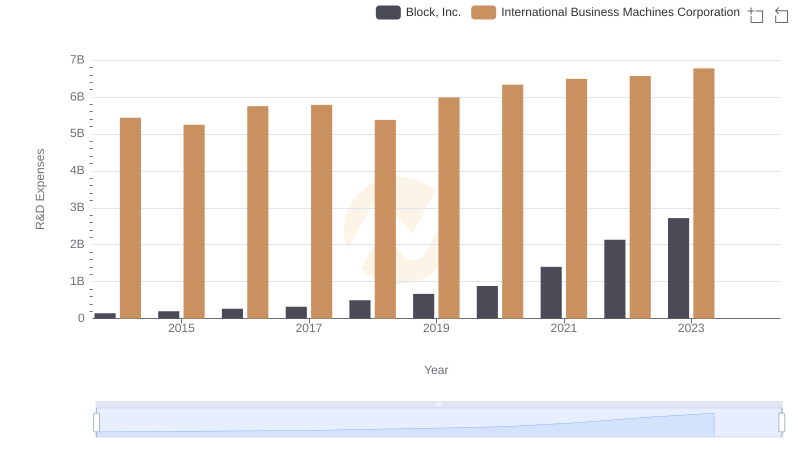
International Business Machines Corporation vs Block, Inc.: Strategic Focus on R&D Spending
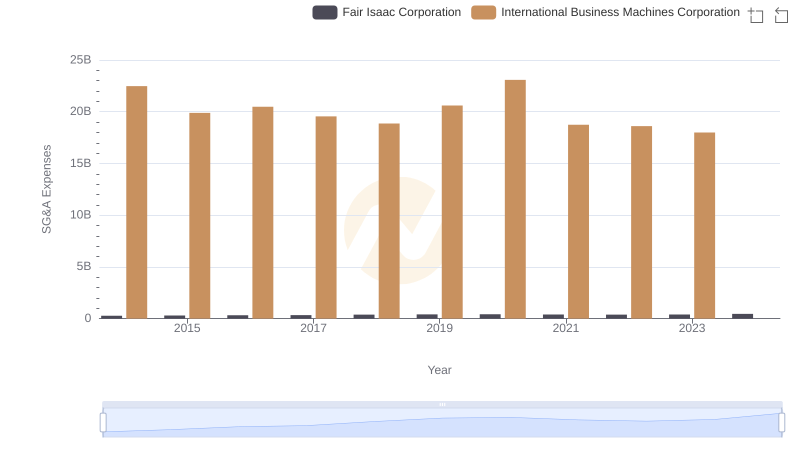
International Business Machines Corporation or Fair Isaac Corporation: Who Manages SG&A Costs Better?
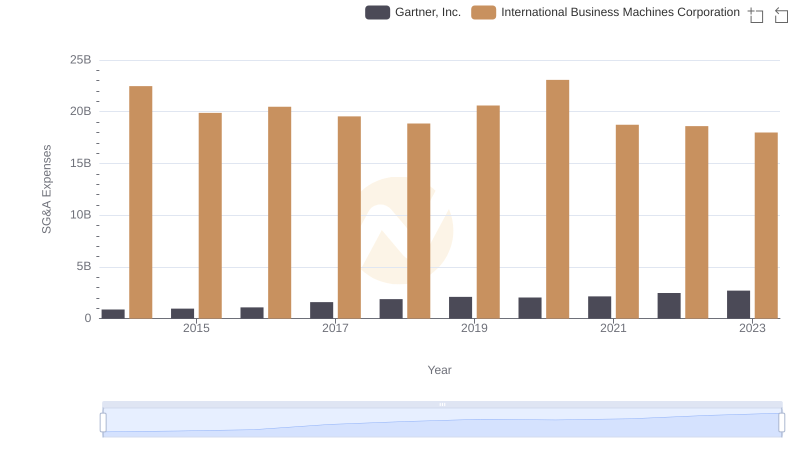
SG&A Efficiency Analysis: Comparing International Business Machines Corporation and Gartner, Inc.
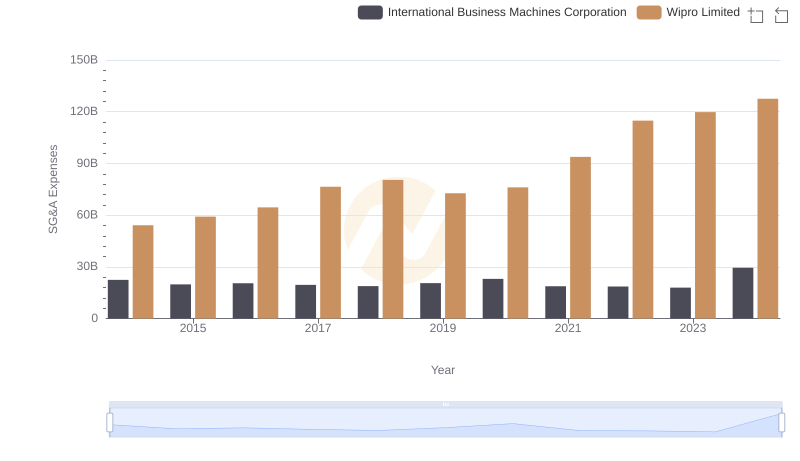
Selling, General, and Administrative Costs: International Business Machines Corporation vs Wipro Limited
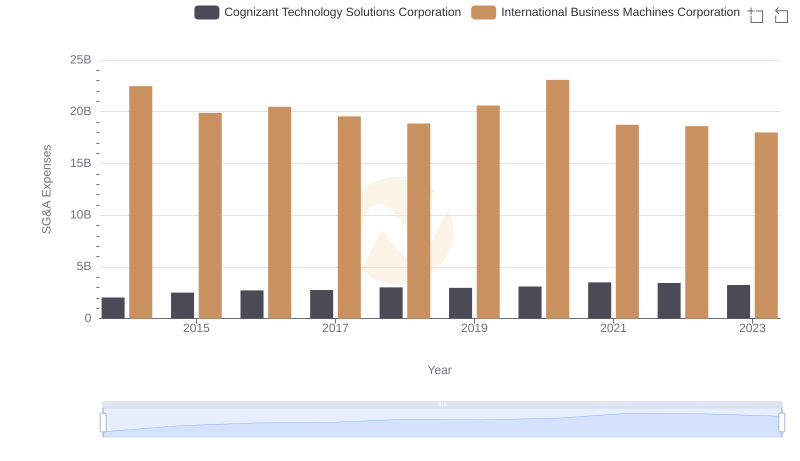
Who Optimizes SG&A Costs Better? International Business Machines Corporation or Cognizant Technology Solutions Corporation
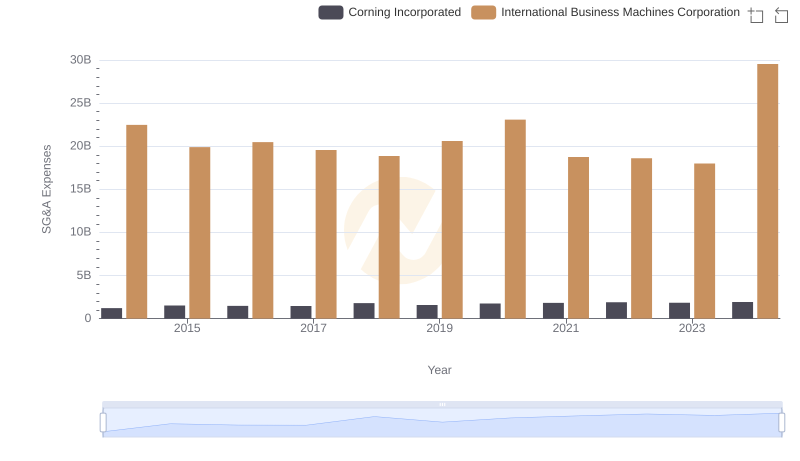
Selling, General, and Administrative Costs: International Business Machines Corporation vs Corning Incorporated
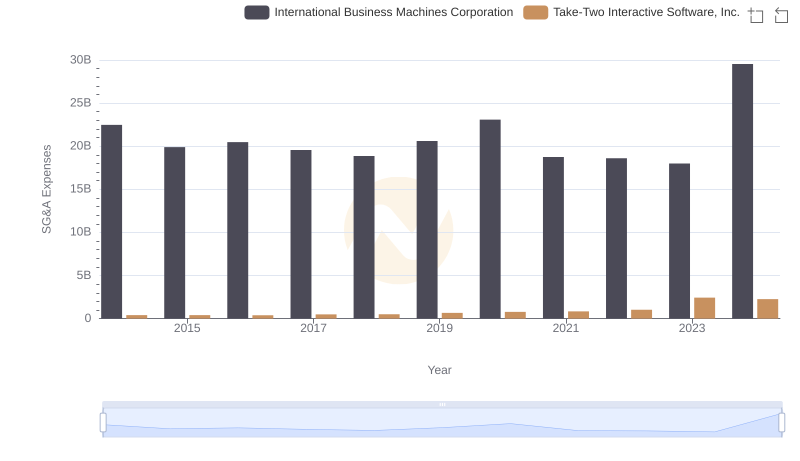
Who Optimizes SG&A Costs Better? International Business Machines Corporation or Take-Two Interactive Software, Inc.
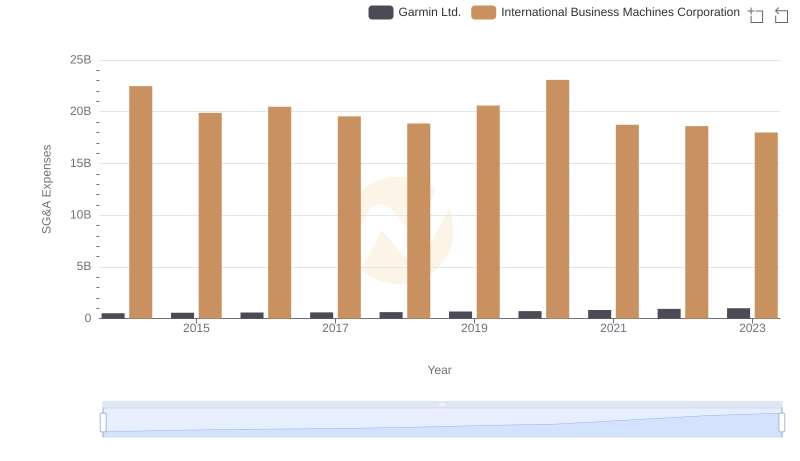
Operational Costs Compared: SG&A Analysis of International Business Machines Corporation and Garmin Ltd.