| __timestamp | Garmin Ltd. | International Business Machines Corporation |
|---|---|---|
| Wednesday, January 1, 2014 | 518665000 | 22472000000 |
| Thursday, January 1, 2015 | 562080000 | 19894000000 |
| Friday, January 1, 2016 | 587701000 | 20279000000 |
| Sunday, January 1, 2017 | 602670000 | 19680000000 |
| Monday, January 1, 2018 | 633571000 | 19366000000 |
| Tuesday, January 1, 2019 | 683024000 | 18724000000 |
| Wednesday, January 1, 2020 | 721411000 | 20561000000 |
| Friday, January 1, 2021 | 831815000 | 18745000000 |
| Saturday, January 1, 2022 | 944003000 | 17483000000 |
| Sunday, January 1, 2023 | 1008099000 | 17997000000 |
| Monday, January 1, 2024 | 1108960000 | 29536000000 |
Cracking the code
In the ever-evolving landscape of technology and innovation, operational efficiency is paramount. This analysis delves into the Selling, General, and Administrative (SG&A) expenses of two industry giants: International Business Machines Corporation (IBM) and Garmin Ltd., from 2014 to 2023. Over this decade, IBM's SG&A expenses have consistently dwarfed those of Garmin, averaging around 20 times higher. Notably, IBM's expenses peaked in 2014, while Garmin's showed a steady upward trend, culminating in a 94% increase by 2023. This divergence highlights IBM's expansive operational scale compared to Garmin's more streamlined approach. Interestingly, 2024 data for Garmin is missing, leaving room for speculation on its future trajectory. As businesses navigate the complexities of global markets, understanding these financial dynamics offers invaluable insights into strategic decision-making and competitive positioning.
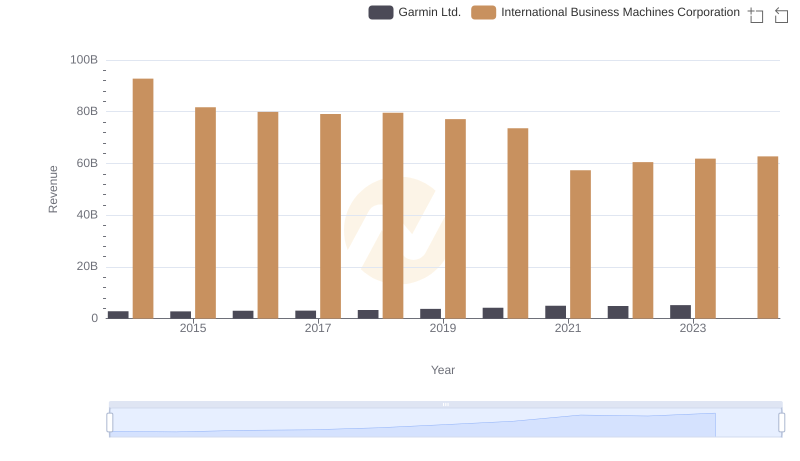
International Business Machines Corporation vs Garmin Ltd.: Examining Key Revenue Metrics
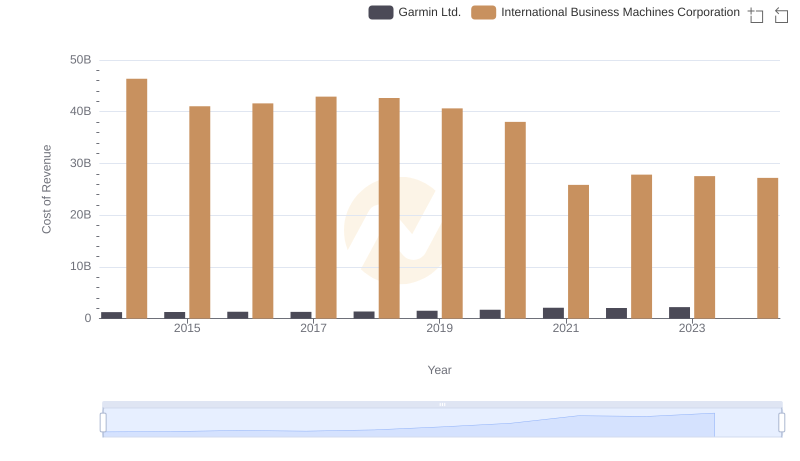
Cost of Revenue Comparison: International Business Machines Corporation vs Garmin Ltd.
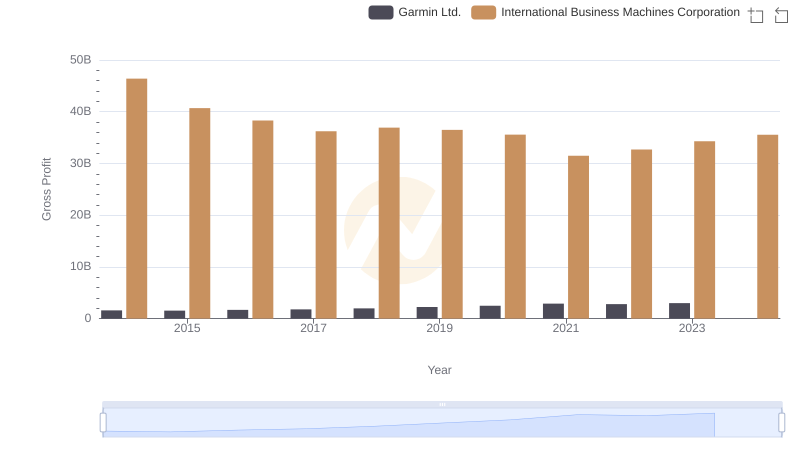
Gross Profit Trends Compared: International Business Machines Corporation vs Garmin Ltd.
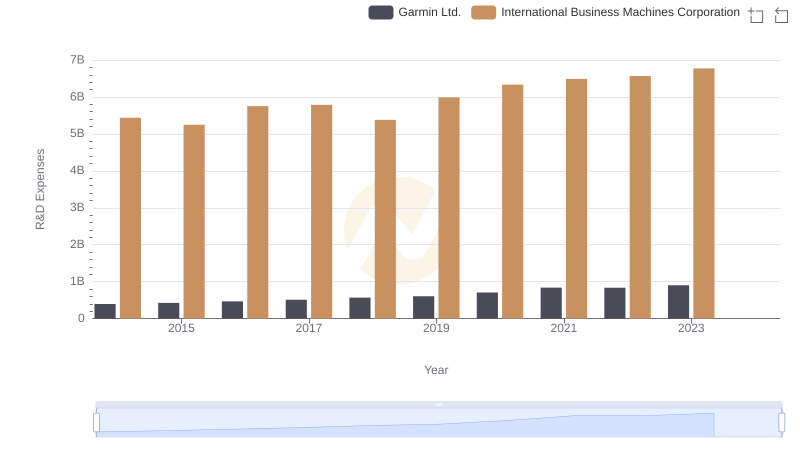
R&D Spending Showdown: International Business Machines Corporation vs Garmin Ltd.
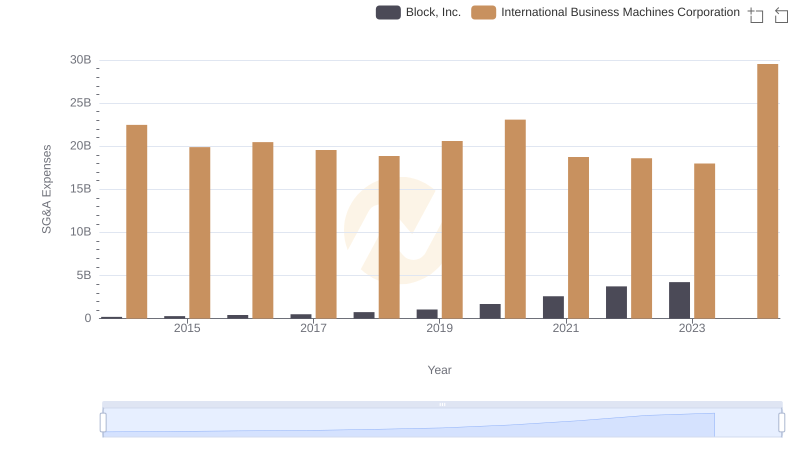
International Business Machines Corporation vs Block, Inc.: SG&A Expense Trends
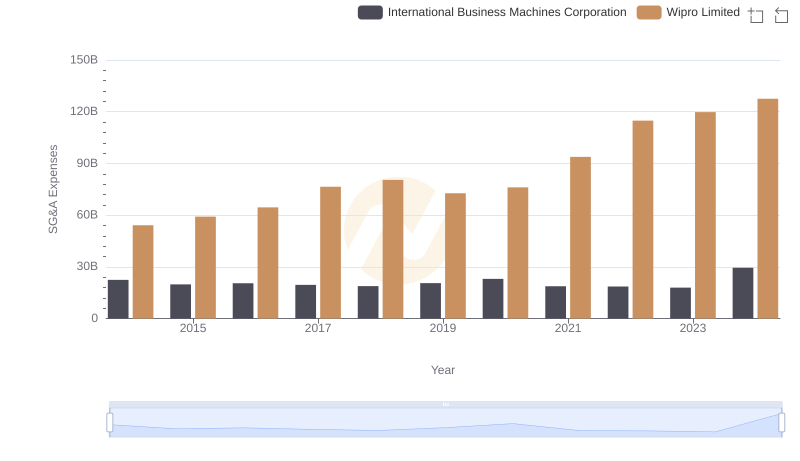
Selling, General, and Administrative Costs: International Business Machines Corporation vs Wipro Limited
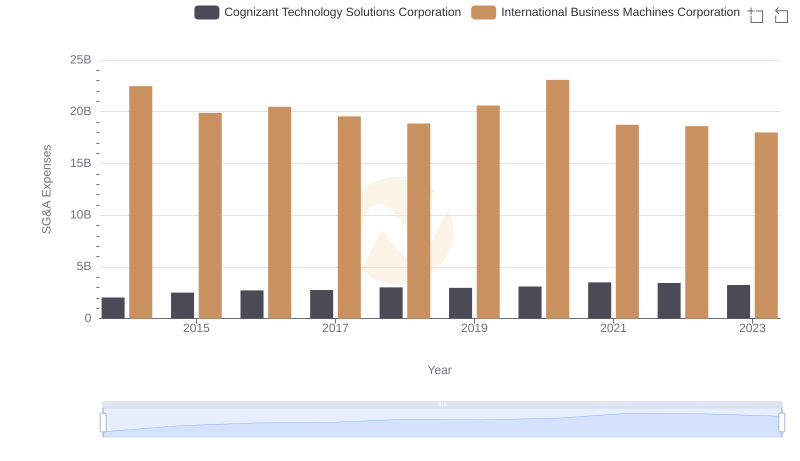
Who Optimizes SG&A Costs Better? International Business Machines Corporation or Cognizant Technology Solutions Corporation
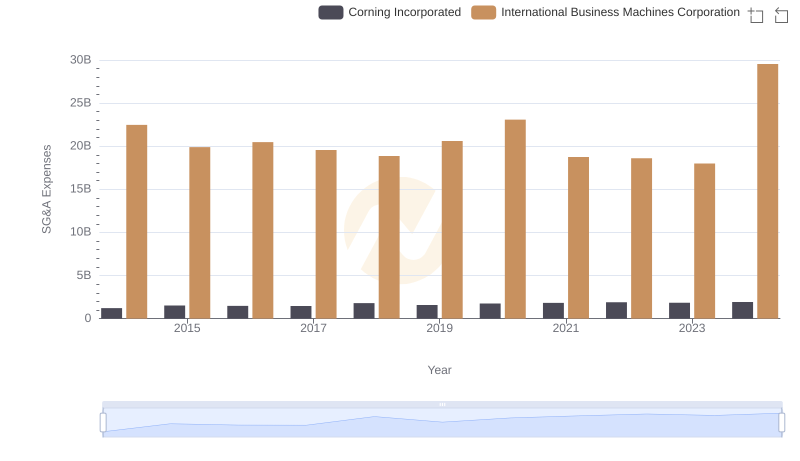
Selling, General, and Administrative Costs: International Business Machines Corporation vs Corning Incorporated
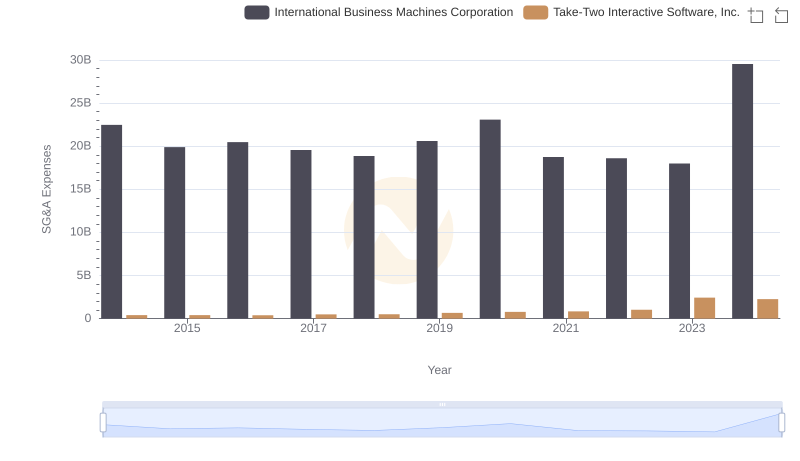
Who Optimizes SG&A Costs Better? International Business Machines Corporation or Take-Two Interactive Software, Inc.
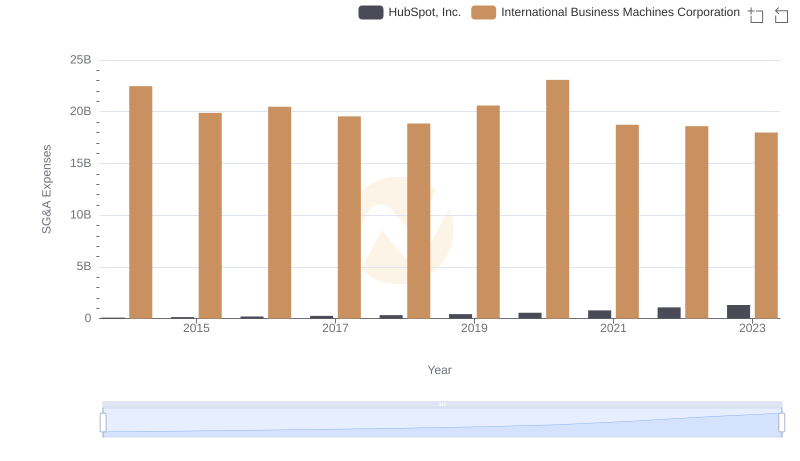
SG&A Efficiency Analysis: Comparing International Business Machines Corporation and HubSpot, Inc.
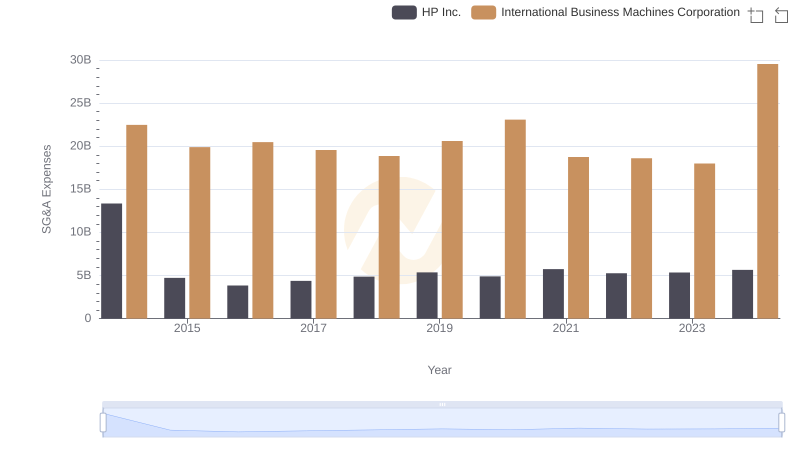
Breaking Down SG&A Expenses: International Business Machines Corporation vs HP Inc.
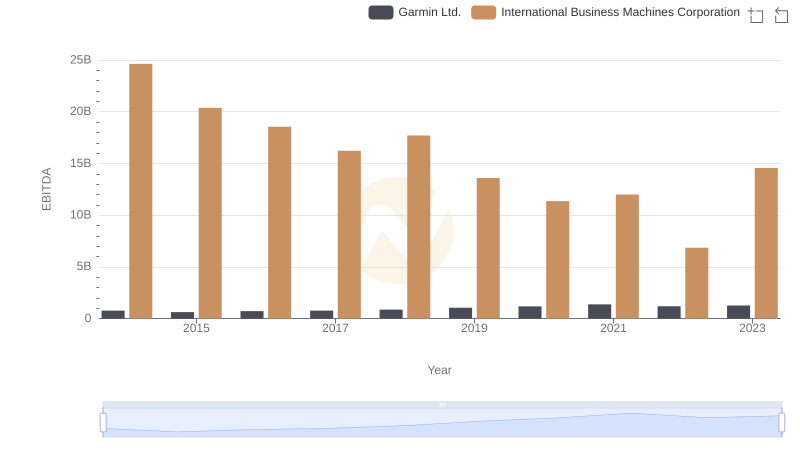
EBITDA Metrics Evaluated: International Business Machines Corporation vs Garmin Ltd.