| __timestamp | HP Inc. | International Business Machines Corporation |
|---|---|---|
| Wednesday, January 1, 2014 | 13353000000 | 22472000000 |
| Thursday, January 1, 2015 | 4720000000 | 19894000000 |
| Friday, January 1, 2016 | 3840000000 | 20279000000 |
| Sunday, January 1, 2017 | 4376000000 | 19680000000 |
| Monday, January 1, 2018 | 4866000000 | 19366000000 |
| Tuesday, January 1, 2019 | 5368000000 | 18724000000 |
| Wednesday, January 1, 2020 | 4906000000 | 20561000000 |
| Friday, January 1, 2021 | 5741000000 | 18745000000 |
| Saturday, January 1, 2022 | 5264000000 | 17483000000 |
| Sunday, January 1, 2023 | 5356000000 | 17997000000 |
| Monday, January 1, 2024 | 5658000000 | 29536000000 |
Cracking the code
In the ever-evolving tech industry, understanding the financial strategies of giants like International Business Machines Corporation (IBM) and HP Inc. is crucial. Over the past decade, IBM has consistently outpaced HP in Selling, General, and Administrative (SG&A) expenses, reflecting its expansive global operations and strategic investments. In 2014, IBM's SG&A expenses were nearly double those of HP, highlighting its aggressive market positioning. However, HP has shown resilience, reducing its SG&A expenses by approximately 60% from 2014 to 2016, a testament to its cost-cutting measures and streamlined operations. By 2023, IBM's expenses saw a slight decline, while HP maintained a steady trajectory, indicating a balanced approach to growth and efficiency. This financial dance between two tech titans offers a window into their strategic priorities and market adaptations.
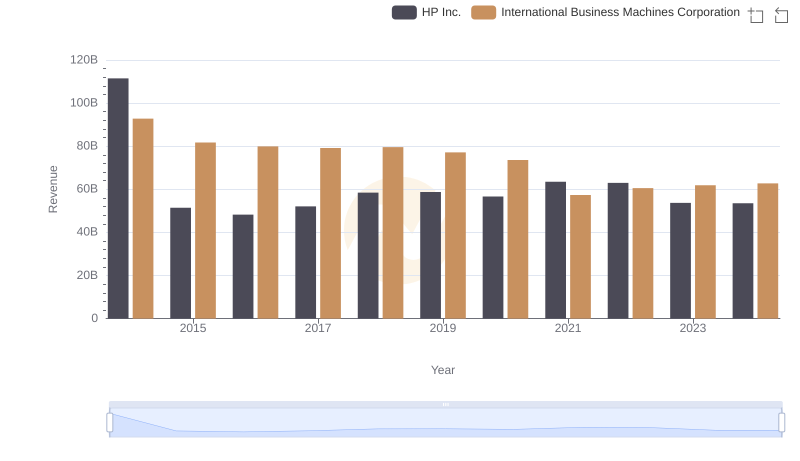
International Business Machines Corporation and HP Inc.: A Comprehensive Revenue Analysis
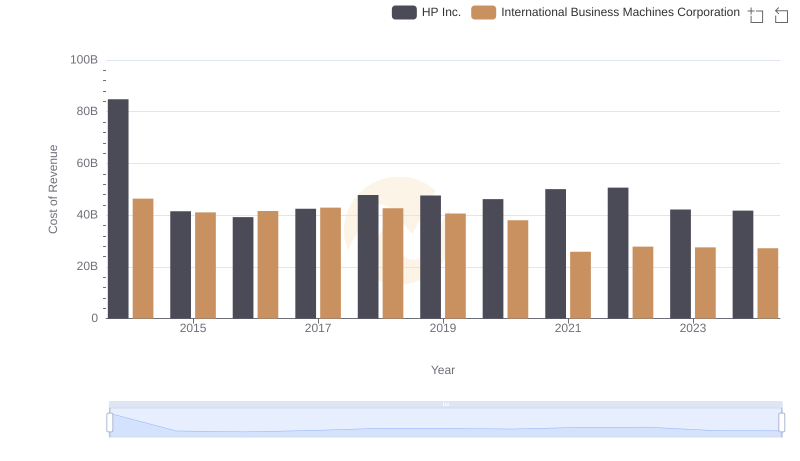
Cost of Revenue: Key Insights for International Business Machines Corporation and HP Inc.
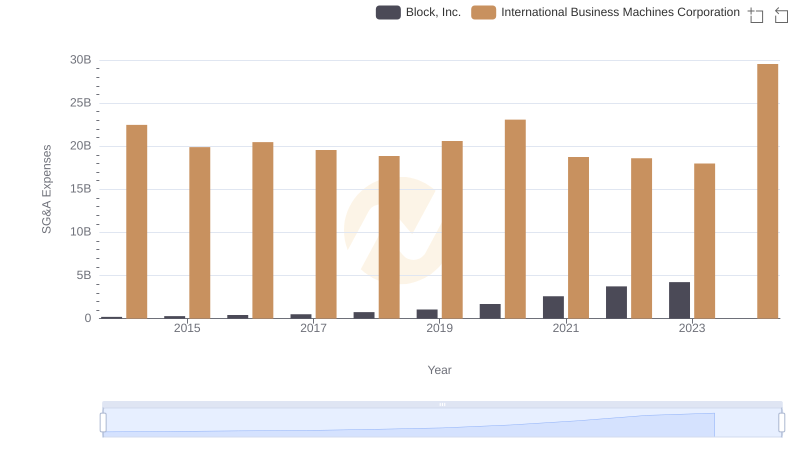
International Business Machines Corporation vs Block, Inc.: SG&A Expense Trends
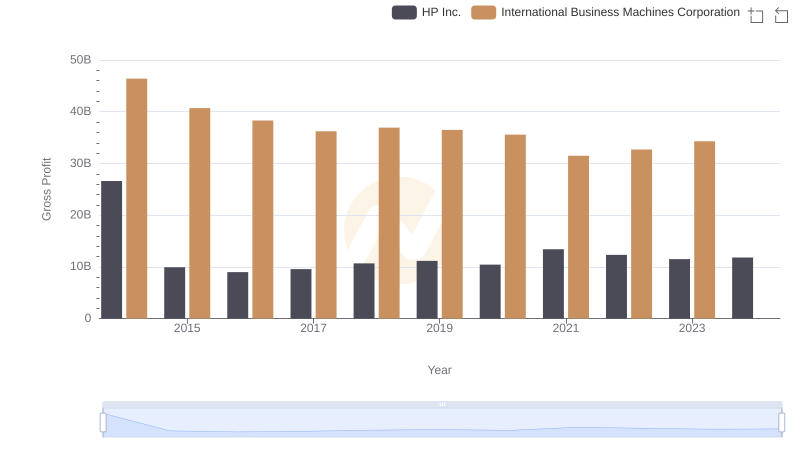
Key Insights on Gross Profit: International Business Machines Corporation vs HP Inc.
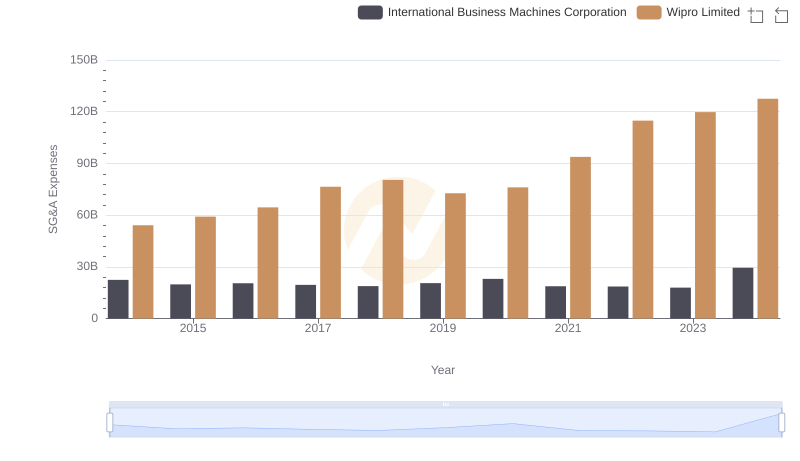
Selling, General, and Administrative Costs: International Business Machines Corporation vs Wipro Limited
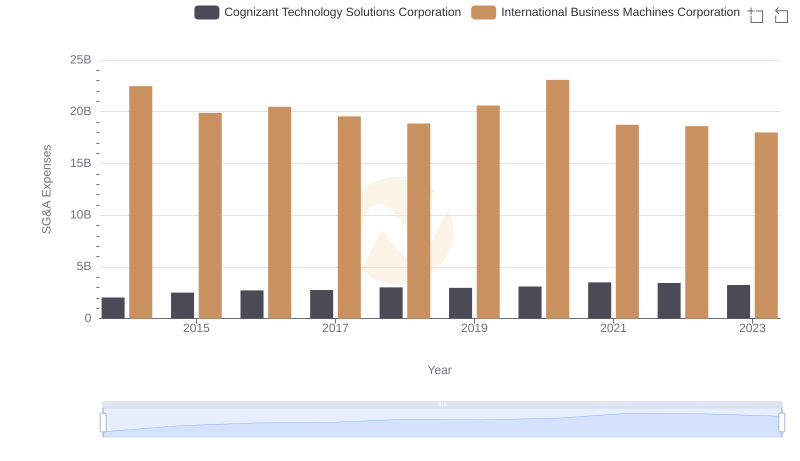
Who Optimizes SG&A Costs Better? International Business Machines Corporation or Cognizant Technology Solutions Corporation
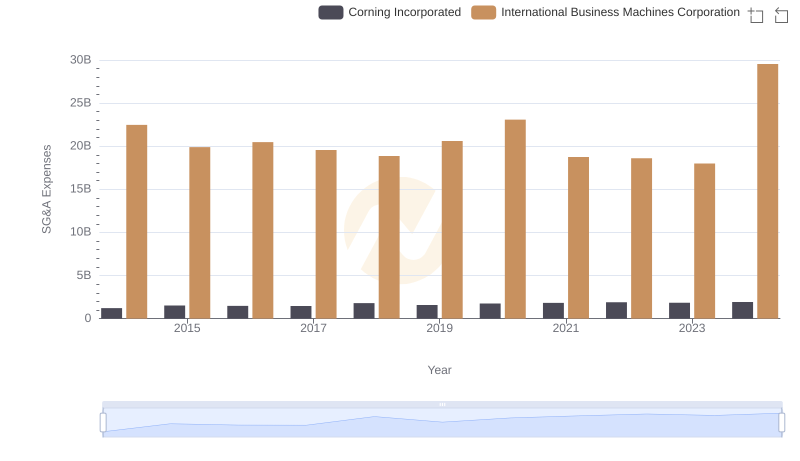
Selling, General, and Administrative Costs: International Business Machines Corporation vs Corning Incorporated
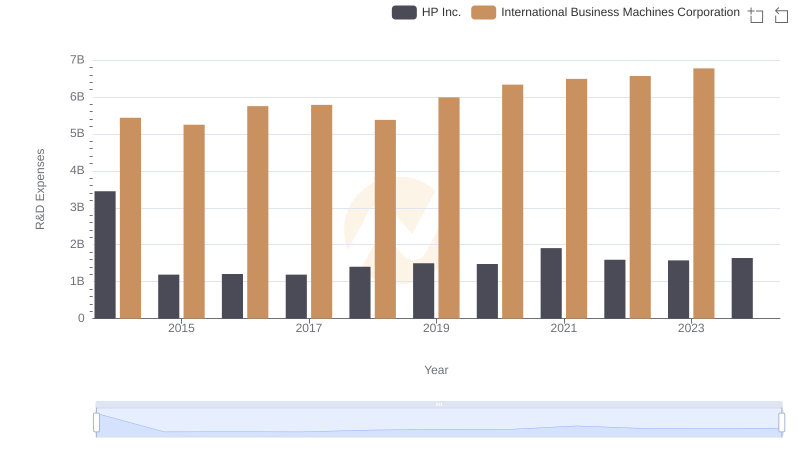
Analyzing R&D Budgets: International Business Machines Corporation vs HP Inc.
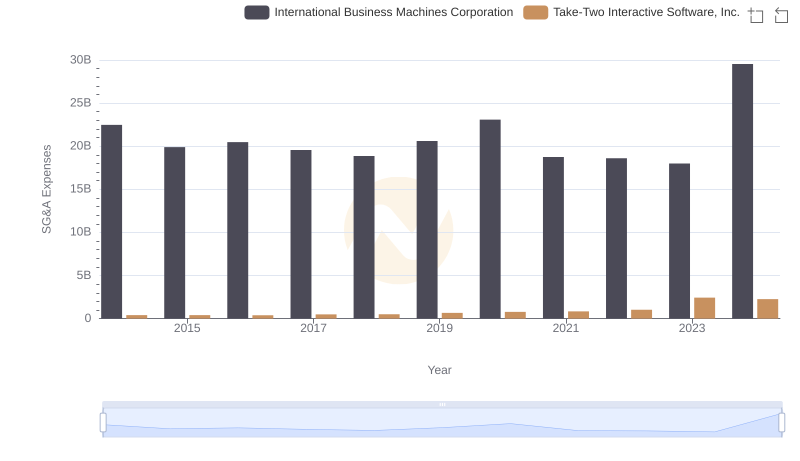
Who Optimizes SG&A Costs Better? International Business Machines Corporation or Take-Two Interactive Software, Inc.
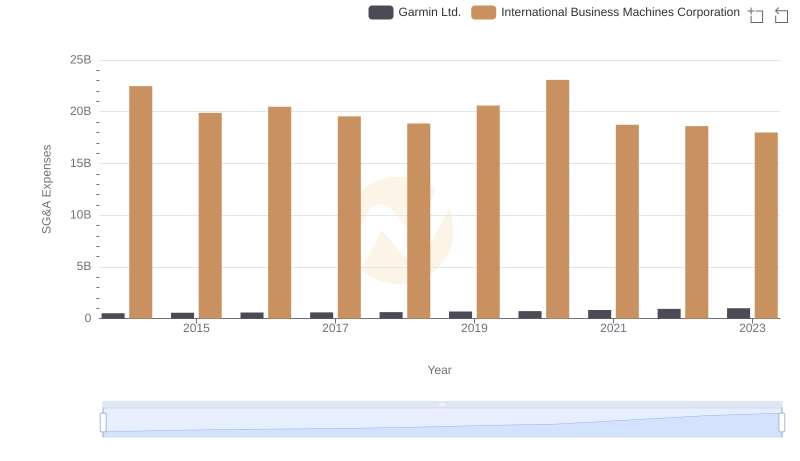
Operational Costs Compared: SG&A Analysis of International Business Machines Corporation and Garmin Ltd.
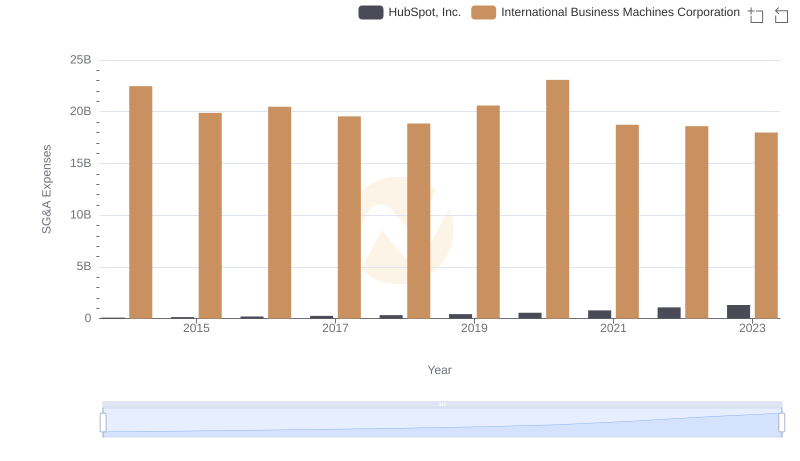
SG&A Efficiency Analysis: Comparing International Business Machines Corporation and HubSpot, Inc.
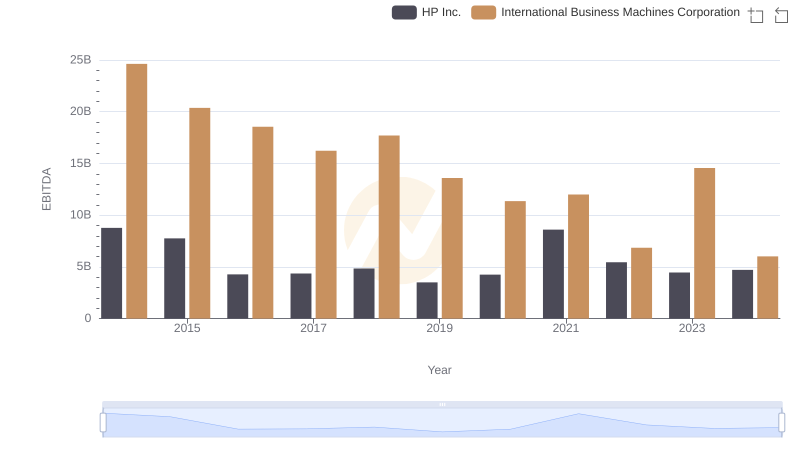
Professional EBITDA Benchmarking: International Business Machines Corporation vs HP Inc.