| __timestamp | Electronic Arts Inc. | International Business Machines Corporation |
|---|---|---|
| Wednesday, January 1, 2014 | 1090000000 | 22472000000 |
| Thursday, January 1, 2015 | 1033000000 | 19894000000 |
| Friday, January 1, 2016 | 1028000000 | 20279000000 |
| Sunday, January 1, 2017 | 1112000000 | 19680000000 |
| Monday, January 1, 2018 | 1110000000 | 19366000000 |
| Tuesday, January 1, 2019 | 1162000000 | 18724000000 |
| Wednesday, January 1, 2020 | 1137000000 | 20561000000 |
| Friday, January 1, 2021 | 1281000000 | 18745000000 |
| Saturday, January 1, 2022 | 1634000000 | 17483000000 |
| Sunday, January 1, 2023 | 1705000000 | 17997000000 |
| Monday, January 1, 2024 | 1710000000 | 29536000000 |
Cracking the code
In the ever-evolving landscape of corporate finance, managing Selling, General, and Administrative (SG&A) expenses is crucial for maintaining profitability. This analysis delves into the SG&A cost management of two industry giants: International Business Machines Corporation (IBM) and Electronic Arts Inc. (EA), from 2014 to 2024.
IBM, a stalwart in the tech industry, consistently reported higher SG&A expenses, averaging around $20.9 billion annually. In contrast, EA, a leader in the gaming sector, maintained a leaner SG&A structure, averaging approximately $1.3 billion per year. Notably, EA's SG&A expenses grew by about 57% over the decade, while IBM's fluctuated, peaking in 2024.
This comparison highlights IBM's larger scale and operational complexity, while EA's agility in cost management reflects its strategic focus on efficiency. As businesses navigate economic uncertainties, understanding these dynamics offers valuable insights into corporate financial strategies.
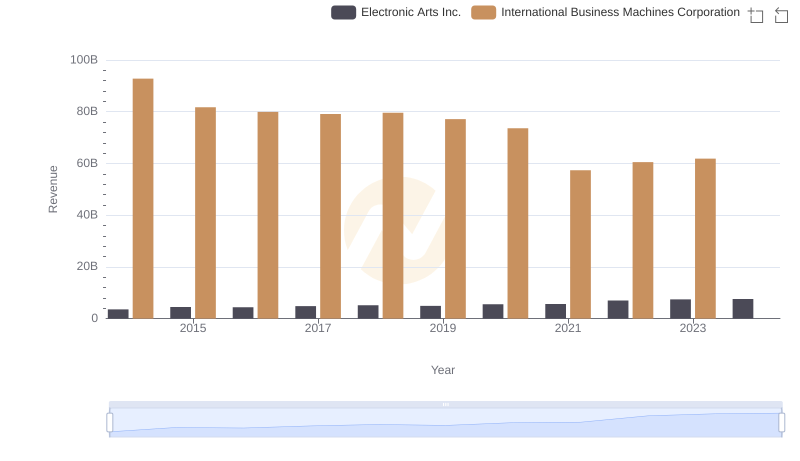
Comparing Revenue Performance: International Business Machines Corporation or Electronic Arts Inc.?
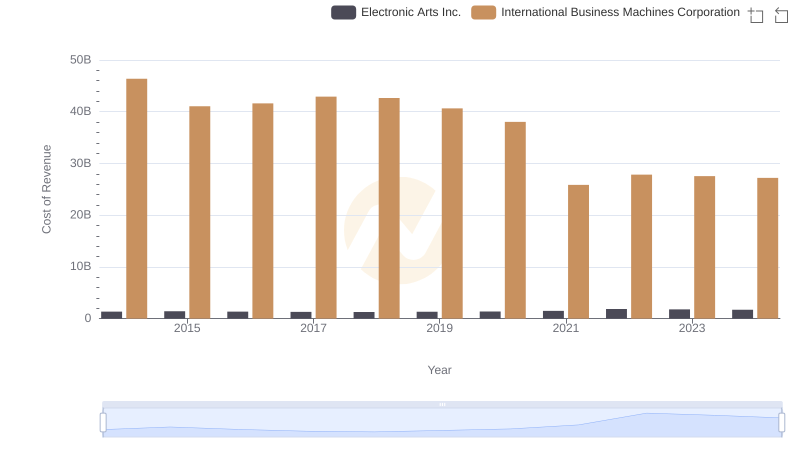
Comparing Cost of Revenue Efficiency: International Business Machines Corporation vs Electronic Arts Inc.
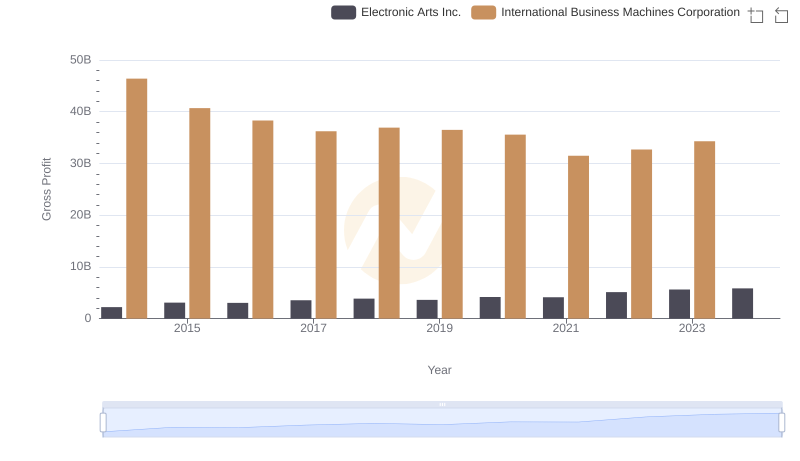
International Business Machines Corporation vs Electronic Arts Inc.: A Gross Profit Performance Breakdown
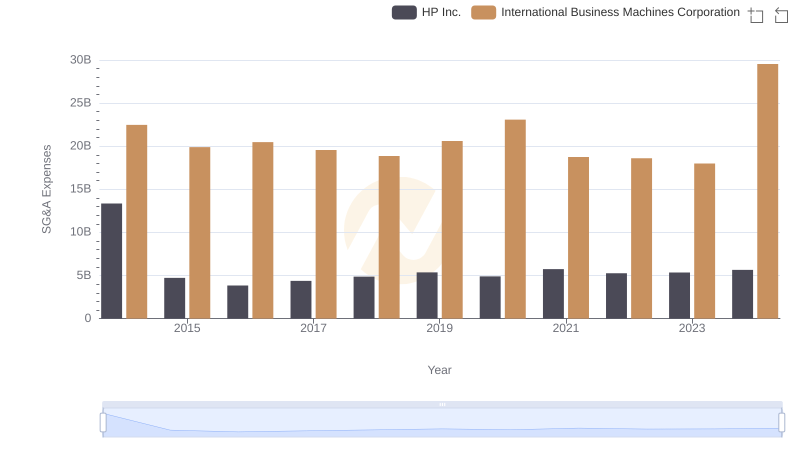
Breaking Down SG&A Expenses: International Business Machines Corporation vs HP Inc.
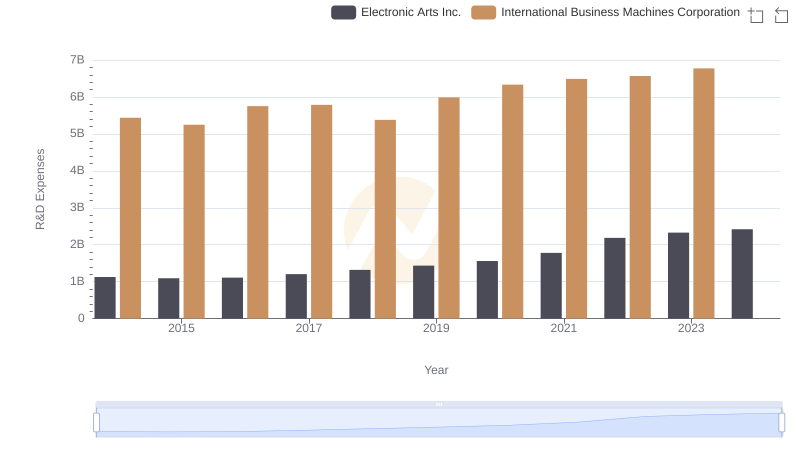
Analyzing R&D Budgets: International Business Machines Corporation vs Electronic Arts Inc.
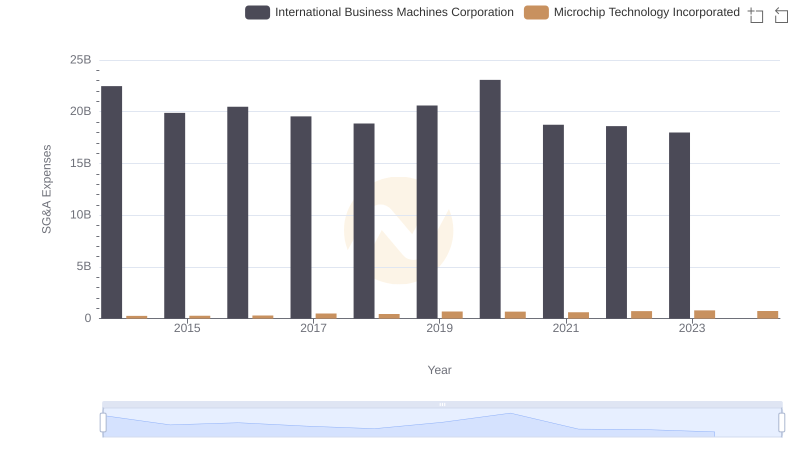
Operational Costs Compared: SG&A Analysis of International Business Machines Corporation and Microchip Technology Incorporated
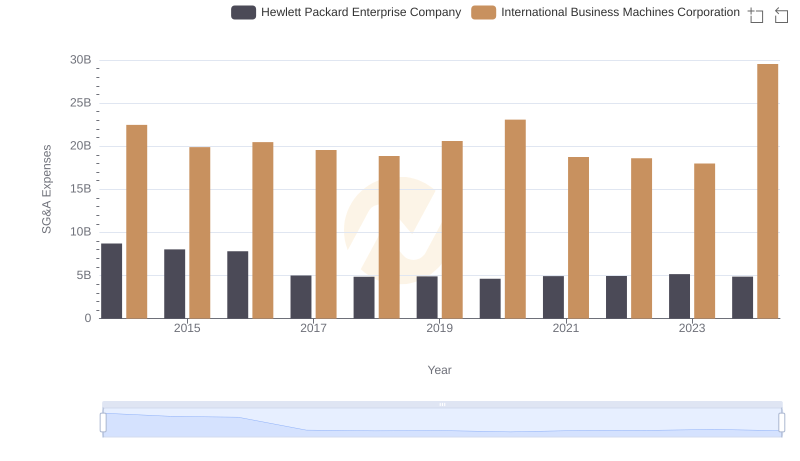
Comparing SG&A Expenses: International Business Machines Corporation vs Hewlett Packard Enterprise Company Trends and Insights
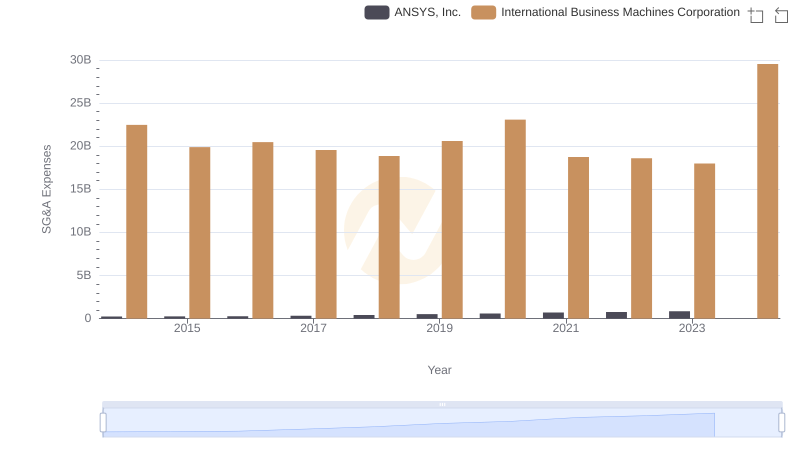
Comparing SG&A Expenses: International Business Machines Corporation vs ANSYS, Inc. Trends and Insights
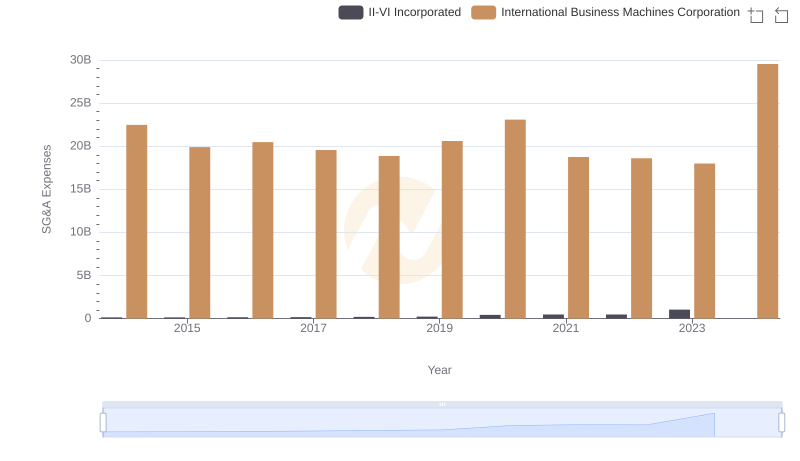
SG&A Efficiency Analysis: Comparing International Business Machines Corporation and II-VI Incorporated
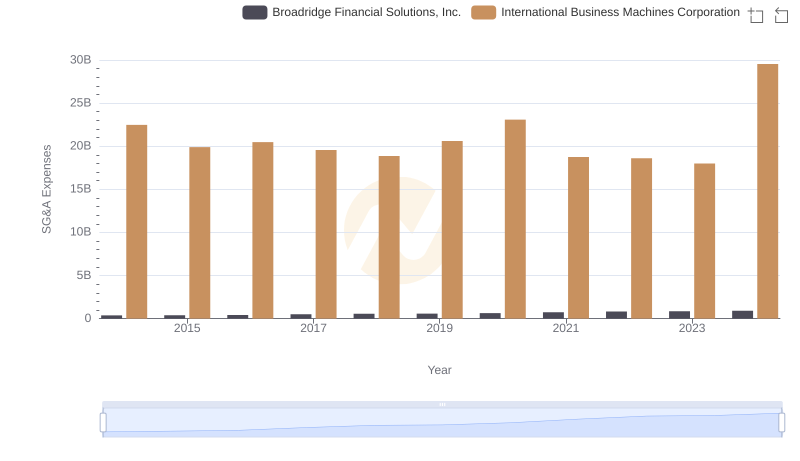
Operational Costs Compared: SG&A Analysis of International Business Machines Corporation and Broadridge Financial Solutions, Inc.
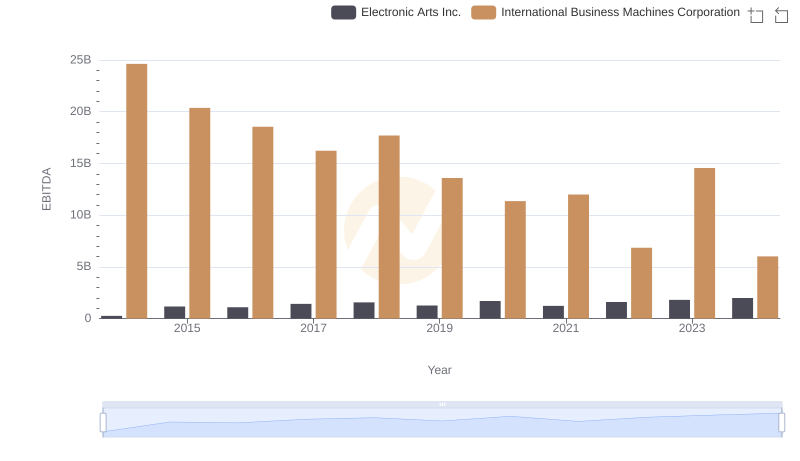
EBITDA Performance Review: International Business Machines Corporation vs Electronic Arts Inc.
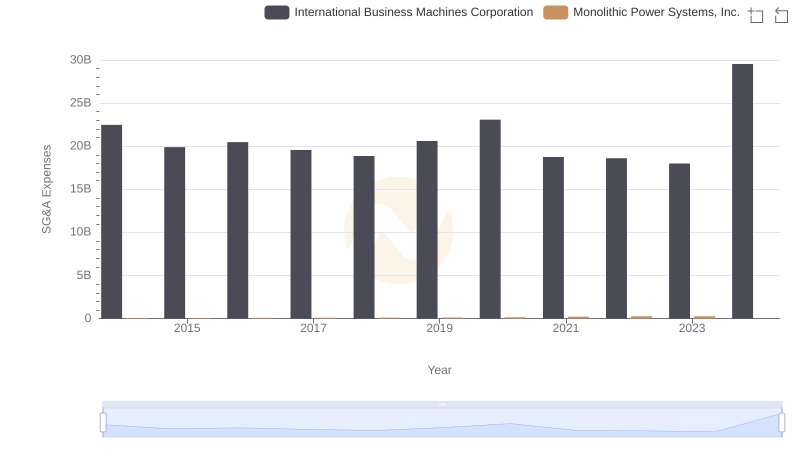
SG&A Efficiency Analysis: Comparing International Business Machines Corporation and Monolithic Power Systems, Inc.