| __timestamp | United Rentals, Inc. | Waste Connections, Inc. |
|---|---|---|
| Wednesday, January 1, 2014 | 2432000000 | 940778000 |
| Thursday, January 1, 2015 | 2480000000 | 939878000 |
| Friday, January 1, 2016 | 2403000000 | 1418151000 |
| Sunday, January 1, 2017 | 2769000000 | 1925713000 |
| Monday, January 1, 2018 | 3364000000 | 2057237000 |
| Tuesday, January 1, 2019 | 3670000000 | 2189922000 |
| Wednesday, January 1, 2020 | 3183000000 | 2169182000 |
| Friday, January 1, 2021 | 3853000000 | 2497287000 |
| Saturday, January 1, 2022 | 4996000000 | 2875847000 |
| Sunday, January 1, 2023 | 5813000000 | 3277438000 |
| Monday, January 1, 2024 | 6150000000 | 3727885000 |
Igniting the spark of knowledge
In the ever-evolving landscape of industrial services, United Rentals, Inc. and Waste Connections, Inc. have emerged as formidable players. Over the past decade, United Rentals has consistently outperformed its counterpart, showcasing a remarkable growth trajectory. From 2014 to 2023, United Rentals' gross profit surged by approximately 153%, reflecting its strategic expansions and market adaptability. In contrast, Waste Connections experienced a steady, albeit slower, growth of around 248% during the same period. Notably, 2023 marked a significant milestone for both companies, with United Rentals achieving a gross profit of $5.8 billion, while Waste Connections reached $3.3 billion. However, data for 2024 remains incomplete, leaving room for speculation on future trends. This comparison not only highlights the dynamic nature of the industry but also underscores the importance of strategic foresight in maintaining competitive advantage.

Comparing Revenue Performance: United Rentals, Inc. or Waste Connections, Inc.?
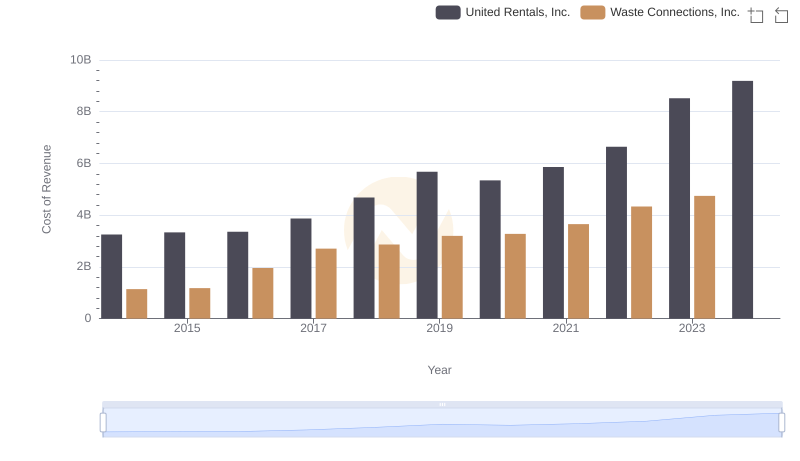
Analyzing Cost of Revenue: United Rentals, Inc. and Waste Connections, Inc.
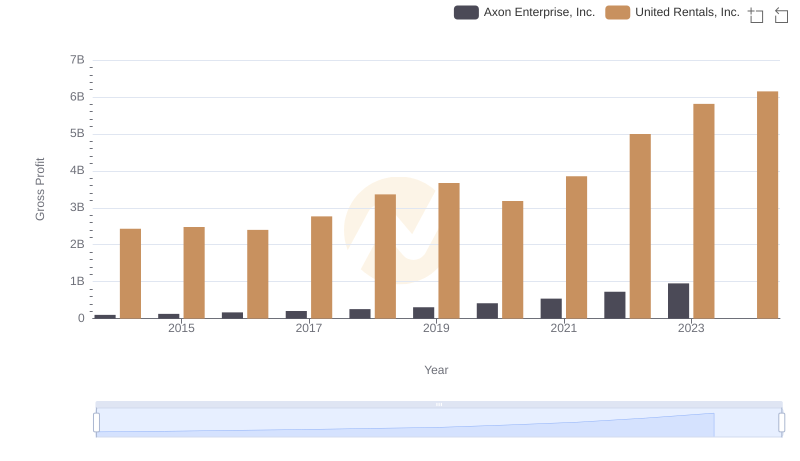
United Rentals, Inc. vs Axon Enterprise, Inc.: A Gross Profit Performance Breakdown
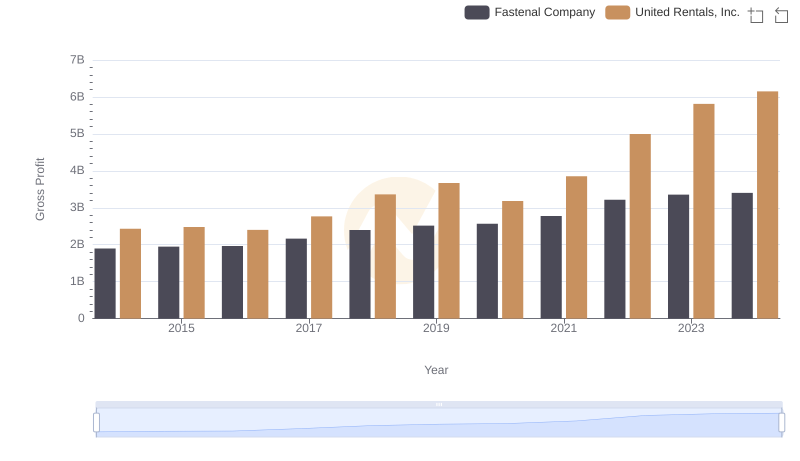
Gross Profit Comparison: United Rentals, Inc. and Fastenal Company Trends
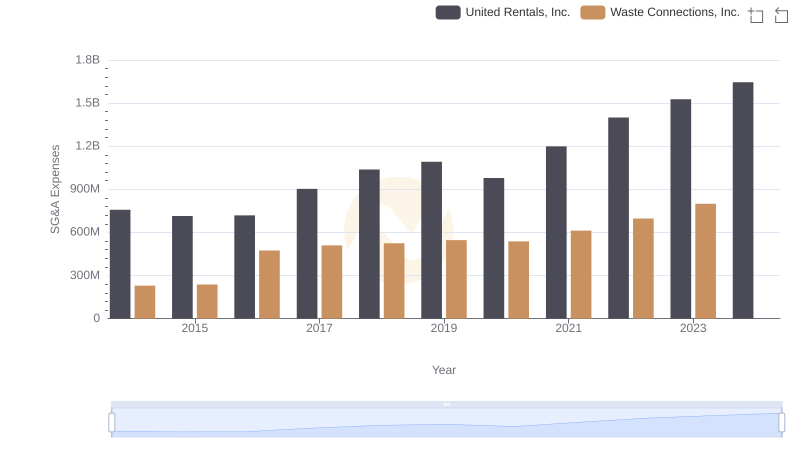
Selling, General, and Administrative Costs: United Rentals, Inc. vs Waste Connections, Inc.
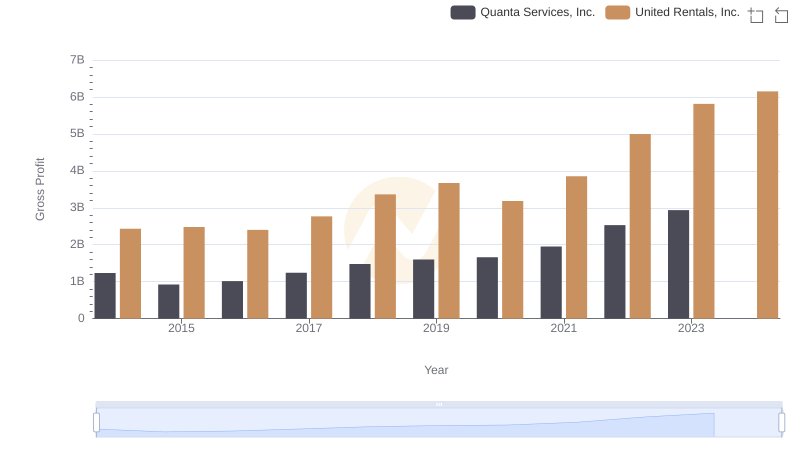
Gross Profit Comparison: United Rentals, Inc. and Quanta Services, Inc. Trends
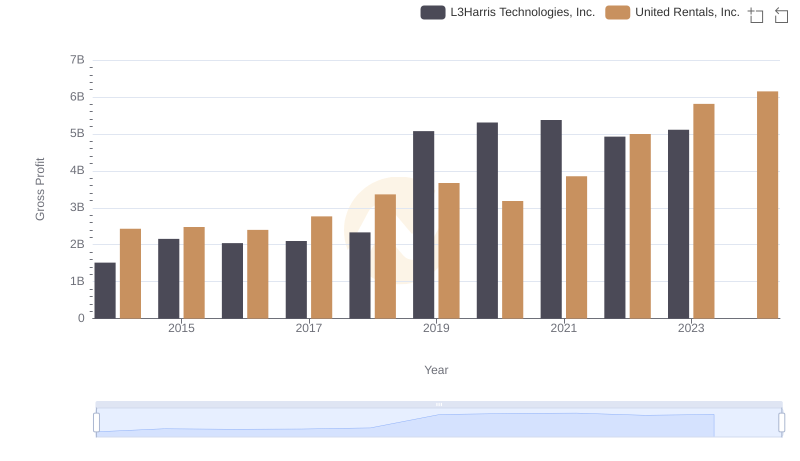
United Rentals, Inc. vs L3Harris Technologies, Inc.: A Gross Profit Performance Breakdown
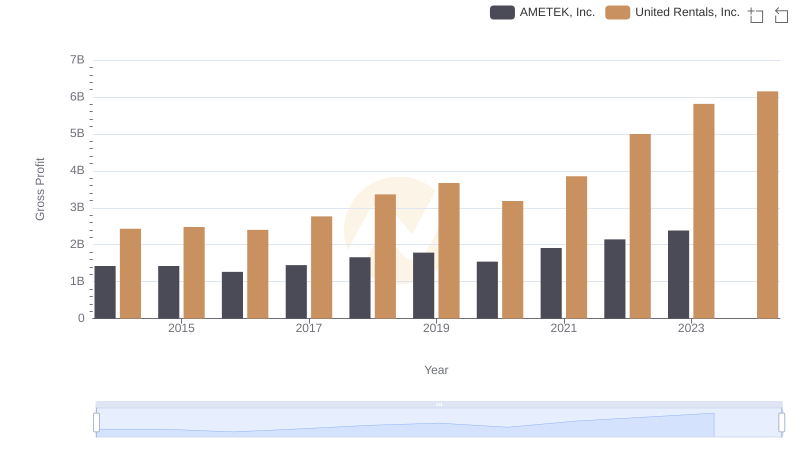
Gross Profit Analysis: Comparing United Rentals, Inc. and AMETEK, Inc.
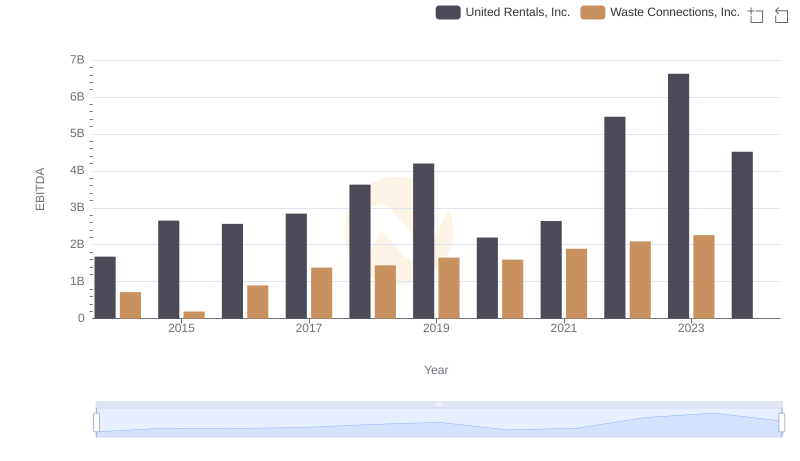
Comparative EBITDA Analysis: United Rentals, Inc. vs Waste Connections, Inc.
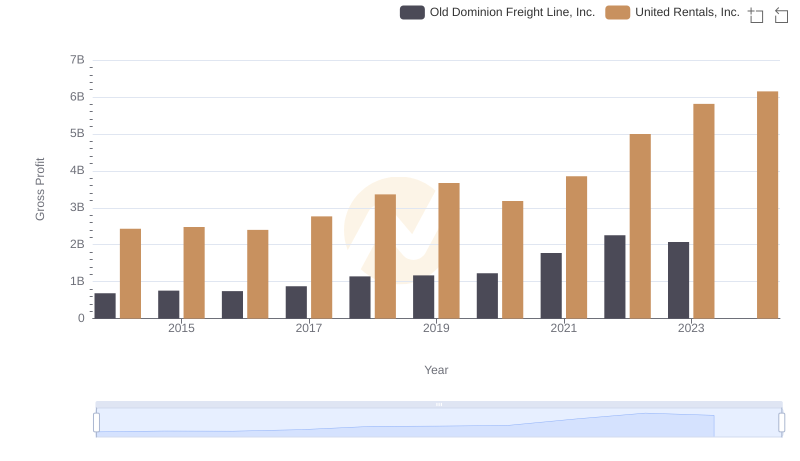
Gross Profit Comparison: United Rentals, Inc. and Old Dominion Freight Line, Inc. Trends
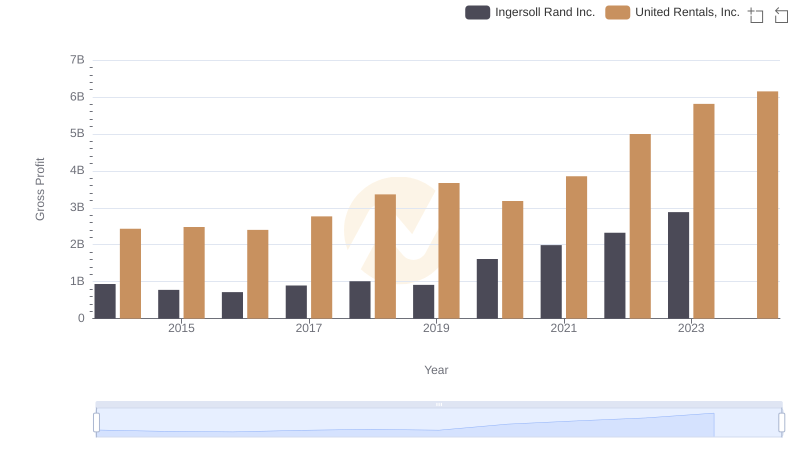
United Rentals, Inc. and Ingersoll Rand Inc.: A Detailed Gross Profit Analysis