| __timestamp | Cummins Inc. | Parker-Hannifin Corporation |
|---|---|---|
| Wednesday, January 1, 2014 | 2095000000 | 1633992000 |
| Thursday, January 1, 2015 | 2092000000 | 1544746000 |
| Friday, January 1, 2016 | 2046000000 | 1359360000 |
| Sunday, January 1, 2017 | 2390000000 | 1453935000 |
| Monday, January 1, 2018 | 2437000000 | 1657152000 |
| Tuesday, January 1, 2019 | 2454000000 | 1543939000 |
| Wednesday, January 1, 2020 | 2125000000 | 1656553000 |
| Friday, January 1, 2021 | 2374000000 | 1527302000 |
| Saturday, January 1, 2022 | 2687000000 | 1627116000 |
| Sunday, January 1, 2023 | 3208000000 | 3354103000 |
| Monday, January 1, 2024 | 3275000000 | 3315177000 |
Unveiling the hidden dimensions of data
In the world of industrial manufacturing, Parker-Hannifin Corporation and Cummins Inc. have long been titans. Over the past decade, their Selling, General, and Administrative (SG&A) expenses have revealed intriguing trends. From 2014 to 2023, Cummins Inc. saw a steady increase in SG&A costs, peaking in 2023 with a 53% rise from 2014. Meanwhile, Parker-Hannifin's expenses remained relatively stable until a dramatic surge in 2023, marking a 105% increase from the previous year. This spike could indicate strategic investments or restructuring efforts. Notably, 2024 data for Cummins is missing, leaving room for speculation. As these companies navigate the complexities of the global market, their financial strategies offer a window into their operational priorities and future directions.
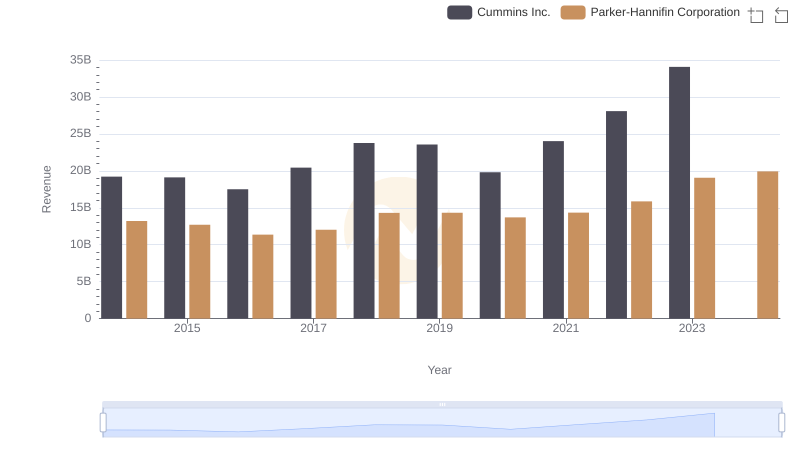
Parker-Hannifin Corporation vs Cummins Inc.: Examining Key Revenue Metrics
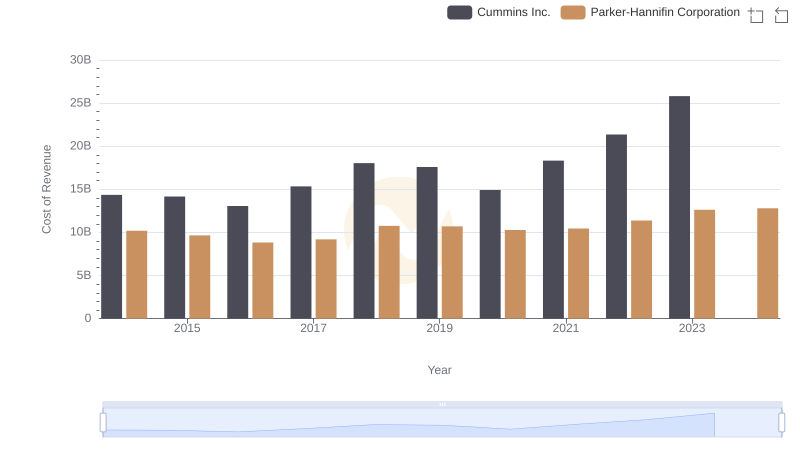
Analyzing Cost of Revenue: Parker-Hannifin Corporation and Cummins Inc.
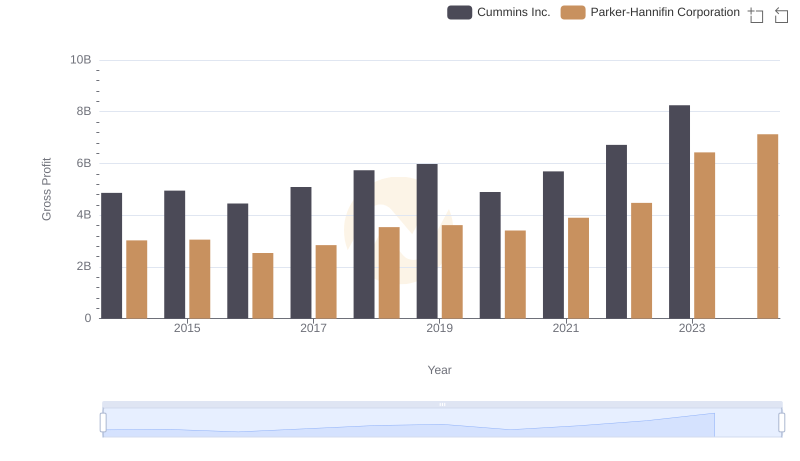
Gross Profit Trends Compared: Parker-Hannifin Corporation vs Cummins Inc.

Parker-Hannifin Corporation or Waste Connections, Inc.: Who Manages SG&A Costs Better?
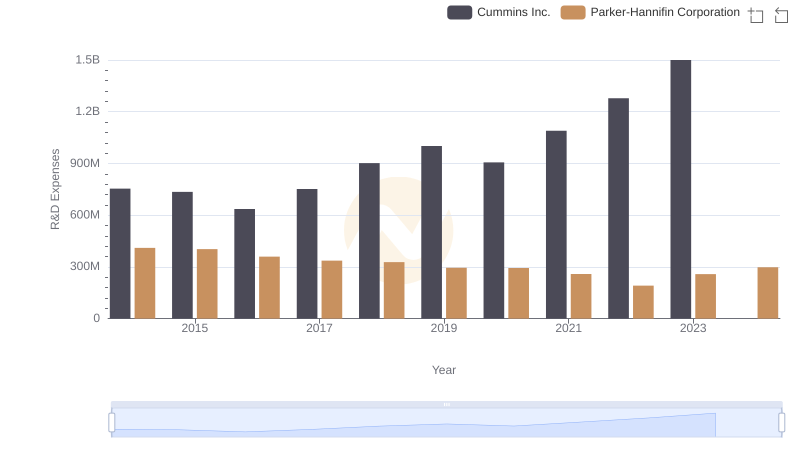
Parker-Hannifin Corporation vs Cummins Inc.: Strategic Focus on R&D Spending
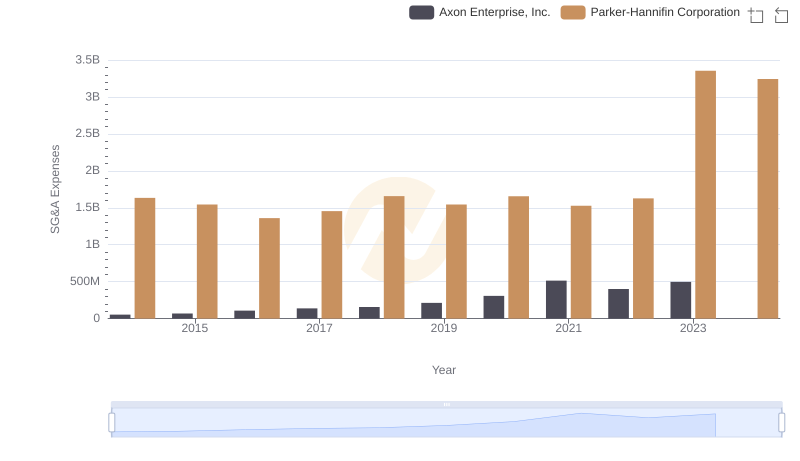
Selling, General, and Administrative Costs: Parker-Hannifin Corporation vs Axon Enterprise, Inc.
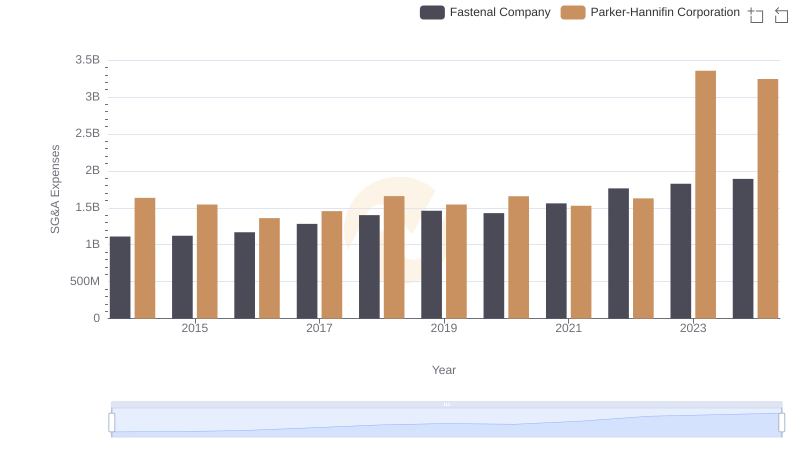
Cost Management Insights: SG&A Expenses for Parker-Hannifin Corporation and Fastenal Company
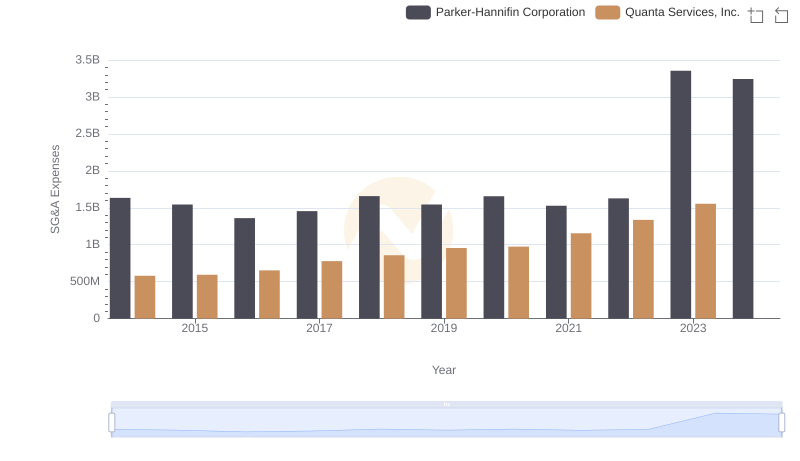
Parker-Hannifin Corporation vs Quanta Services, Inc.: SG&A Expense Trends
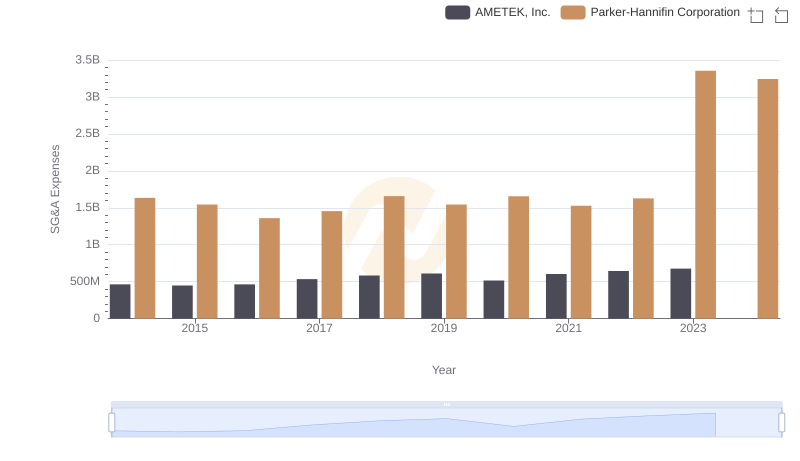
Selling, General, and Administrative Costs: Parker-Hannifin Corporation vs AMETEK, Inc.

Cost Management Insights: SG&A Expenses for Parker-Hannifin Corporation and Old Dominion Freight Line, Inc.
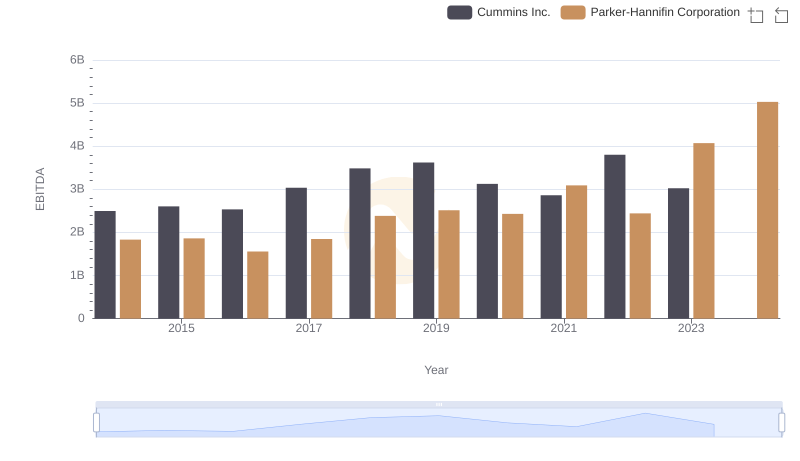
A Professional Review of EBITDA: Parker-Hannifin Corporation Compared to Cummins Inc.