| __timestamp | Cummins Inc. | Parker-Hannifin Corporation |
|---|---|---|
| Wednesday, January 1, 2014 | 19221000000 | 13215971000 |
| Thursday, January 1, 2015 | 19110000000 | 12711744000 |
| Friday, January 1, 2016 | 17509000000 | 11360753000 |
| Sunday, January 1, 2017 | 20428000000 | 12029312000 |
| Monday, January 1, 2018 | 23771000000 | 14302392000 |
| Tuesday, January 1, 2019 | 23571000000 | 14320324000 |
| Wednesday, January 1, 2020 | 19811000000 | 13695520000 |
| Friday, January 1, 2021 | 24021000000 | 14347640000 |
| Saturday, January 1, 2022 | 28074000000 | 15861608000 |
| Sunday, January 1, 2023 | 34065000000 | 19065194000 |
| Monday, January 1, 2024 | 34102000000 | 19929606000 |
Infusing magic into the data realm
In the competitive landscape of industrial manufacturing, Parker-Hannifin Corporation and Cummins Inc. have been pivotal players. Over the past decade, from 2014 to 2023, these giants have showcased remarkable revenue trajectories. Cummins Inc. has seen its revenue grow by approximately 77%, peaking in 2023, while Parker-Hannifin Corporation experienced a 44% increase over the same period. Notably, Cummins' revenue surged from around $19 billion in 2014 to over $34 billion in 2023, reflecting its robust market strategies and global expansion. Meanwhile, Parker-Hannifin's revenue rose from about $13 billion to nearly $19 billion, underscoring its steady growth and innovation in motion and control technologies. The data for 2024 is incomplete, highlighting the dynamic nature of these industries. As these companies continue to evolve, their financial performance remains a testament to their resilience and adaptability in a rapidly changing market.
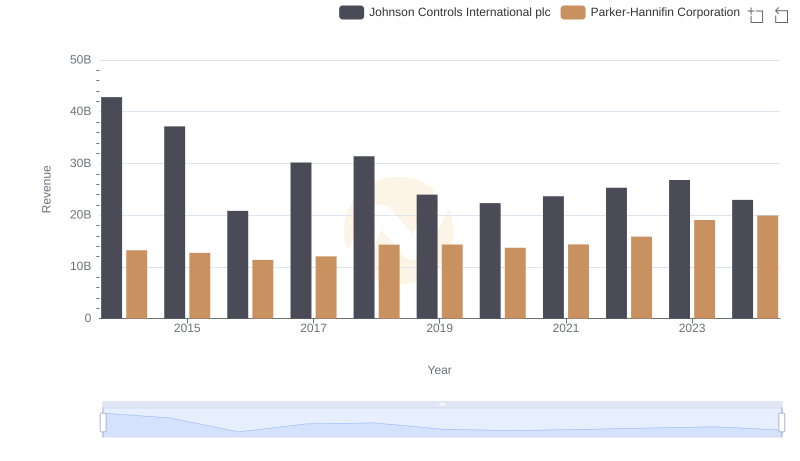
Who Generates More Revenue? Parker-Hannifin Corporation or Johnson Controls International plc
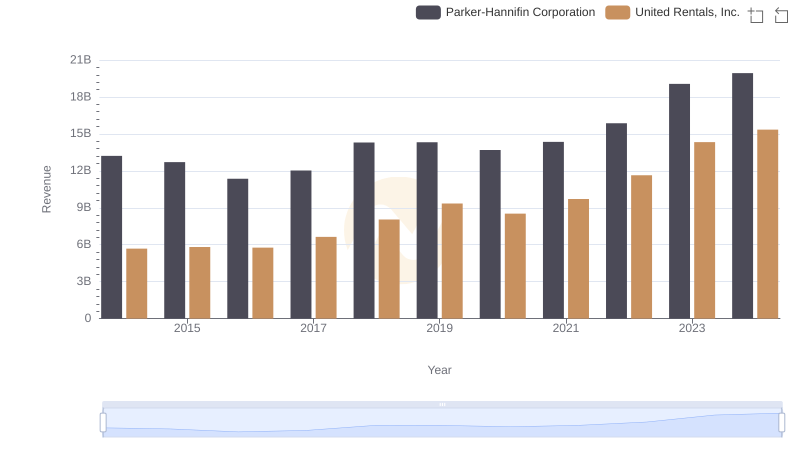
Parker-Hannifin Corporation vs United Rentals, Inc.: Examining Key Revenue Metrics
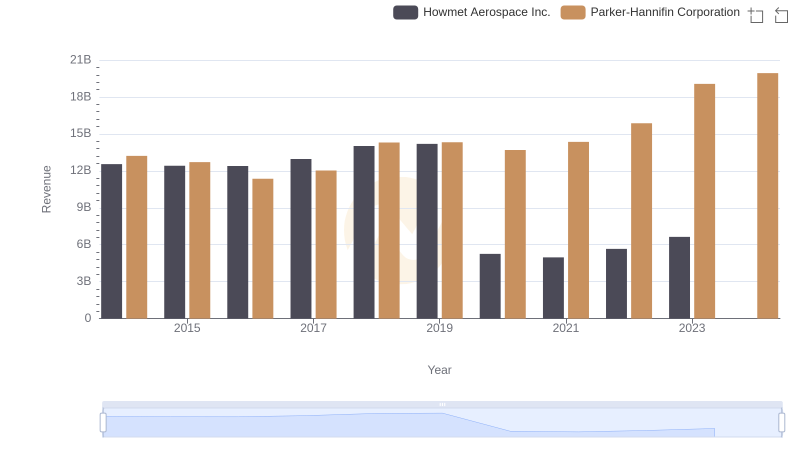
Breaking Down Revenue Trends: Parker-Hannifin Corporation vs Howmet Aerospace Inc.
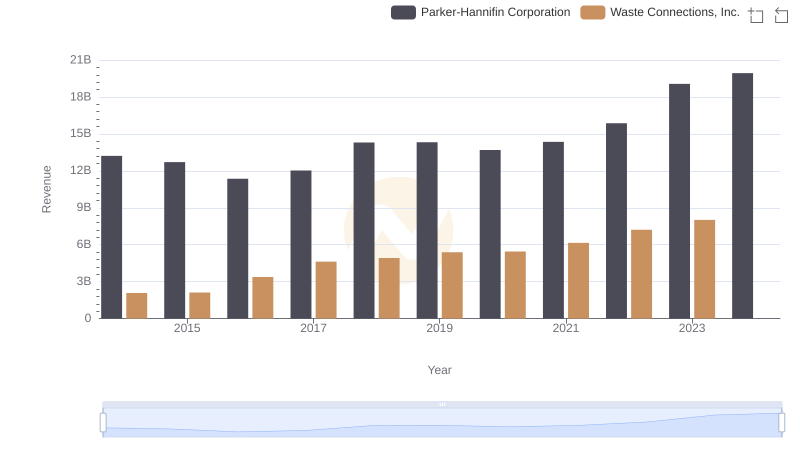
Parker-Hannifin Corporation vs Waste Connections, Inc.: Annual Revenue Growth Compared
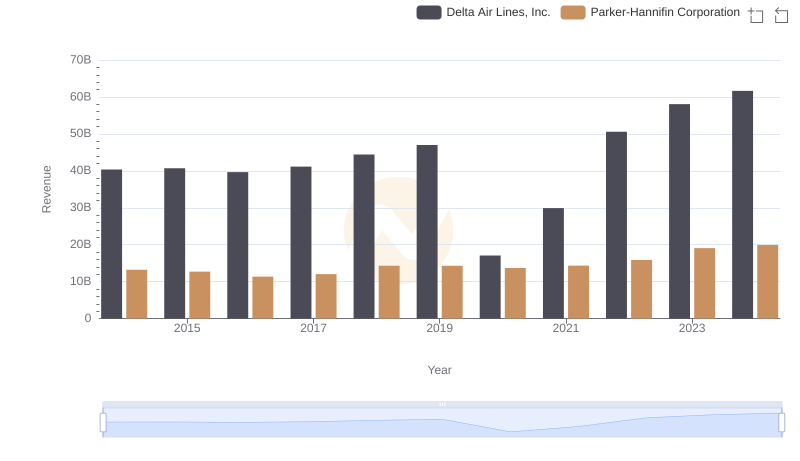
Parker-Hannifin Corporation or Delta Air Lines, Inc.: Who Leads in Yearly Revenue?
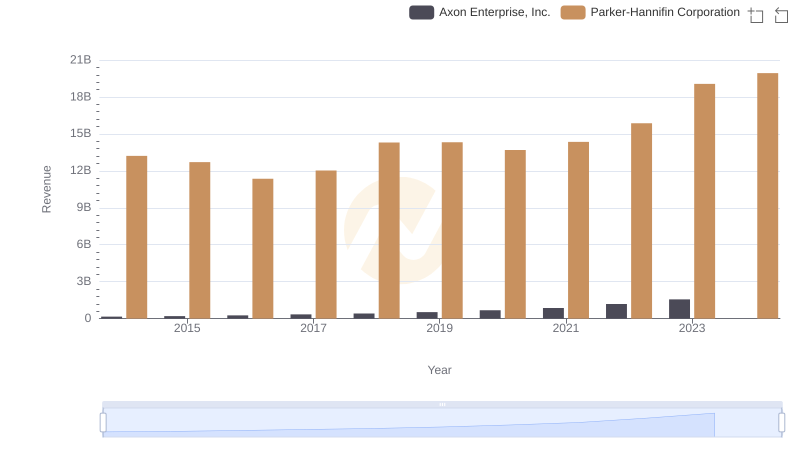
Breaking Down Revenue Trends: Parker-Hannifin Corporation vs Axon Enterprise, Inc.
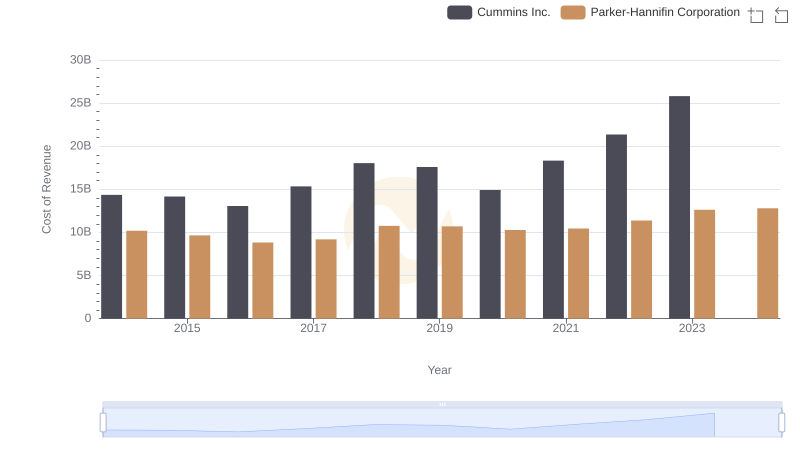
Analyzing Cost of Revenue: Parker-Hannifin Corporation and Cummins Inc.
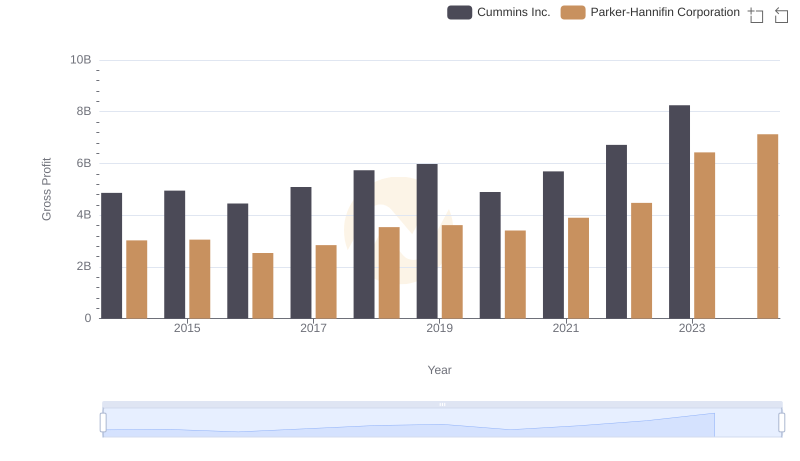
Gross Profit Trends Compared: Parker-Hannifin Corporation vs Cummins Inc.
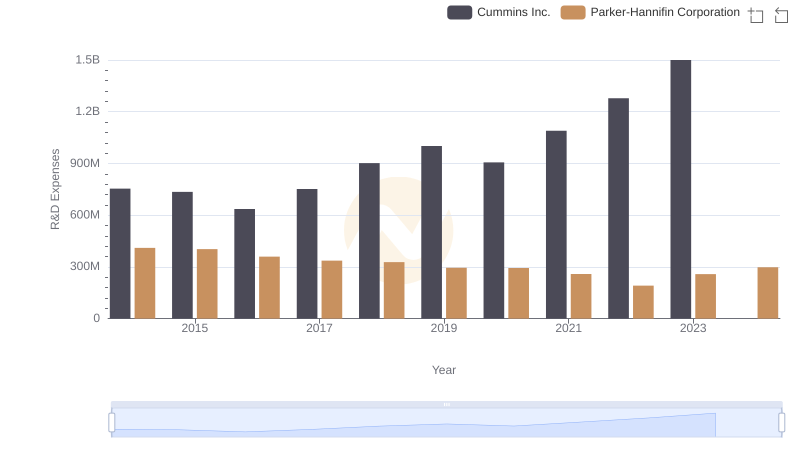
Parker-Hannifin Corporation vs Cummins Inc.: Strategic Focus on R&D Spending
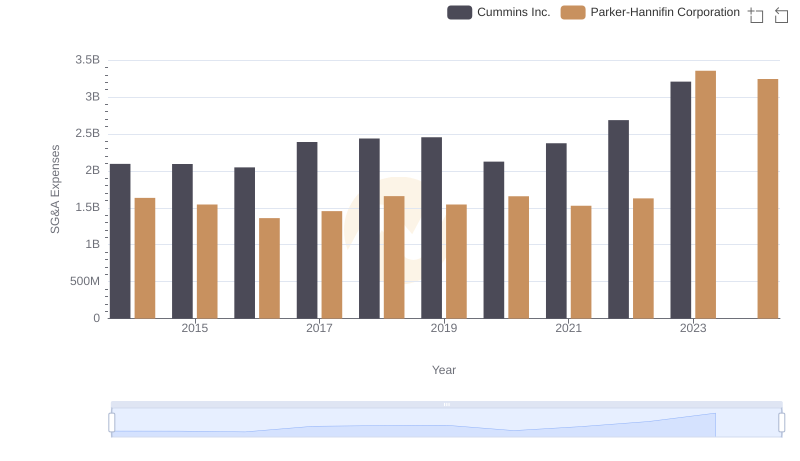
Selling, General, and Administrative Costs: Parker-Hannifin Corporation vs Cummins Inc.
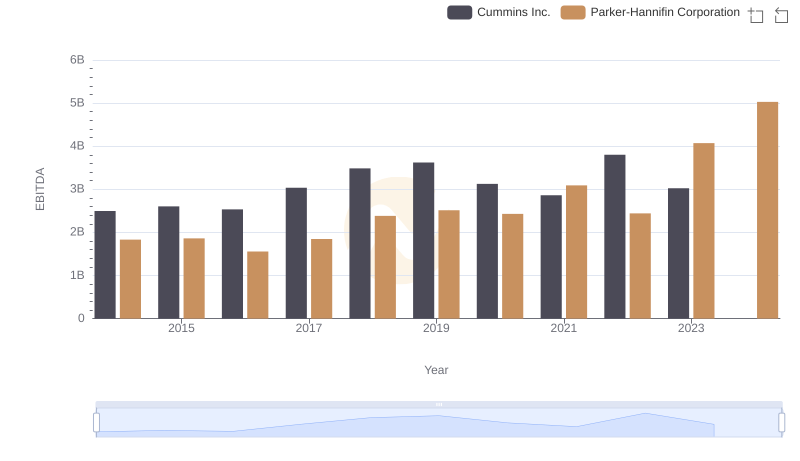
A Professional Review of EBITDA: Parker-Hannifin Corporation Compared to Cummins Inc.