| __timestamp | Cummins Inc. | Parker-Hannifin Corporation |
|---|---|---|
| Wednesday, January 1, 2014 | 2498000000 | 1832903000 |
| Thursday, January 1, 2015 | 2604000000 | 1861551000 |
| Friday, January 1, 2016 | 2534000000 | 1558088000 |
| Sunday, January 1, 2017 | 3035000000 | 1846306000 |
| Monday, January 1, 2018 | 3486000000 | 2382235000 |
| Tuesday, January 1, 2019 | 3623000000 | 2513468000 |
| Wednesday, January 1, 2020 | 3125000000 | 2431500000 |
| Friday, January 1, 2021 | 2862000000 | 3092383000 |
| Saturday, January 1, 2022 | 3802000000 | 2441242000 |
| Sunday, January 1, 2023 | 3025000000 | 4071687000 |
| Monday, January 1, 2024 | 6338000000 | 5028229000 |
Unveiling the hidden dimensions of data
In the ever-evolving landscape of industrial giants, Parker-Hannifin Corporation and Cummins Inc. have consistently demonstrated their prowess. Over the past decade, Parker-Hannifin has shown a remarkable growth trajectory, with its EBITDA surging by approximately 122% from 2014 to 2023. This growth is particularly notable in 2023, where Parker-Hannifin's EBITDA reached an impressive 4.07 billion, a significant leap from previous years.
Conversely, Cummins Inc. has maintained a steady performance, with its EBITDA peaking in 2022 at 3.80 billion, marking a 52% increase since 2014. However, 2023 saw a slight dip, highlighting the dynamic challenges faced by the industry.
This analysis underscores the resilience and strategic adaptability of these corporations, offering valuable insights for investors and industry enthusiasts alike.
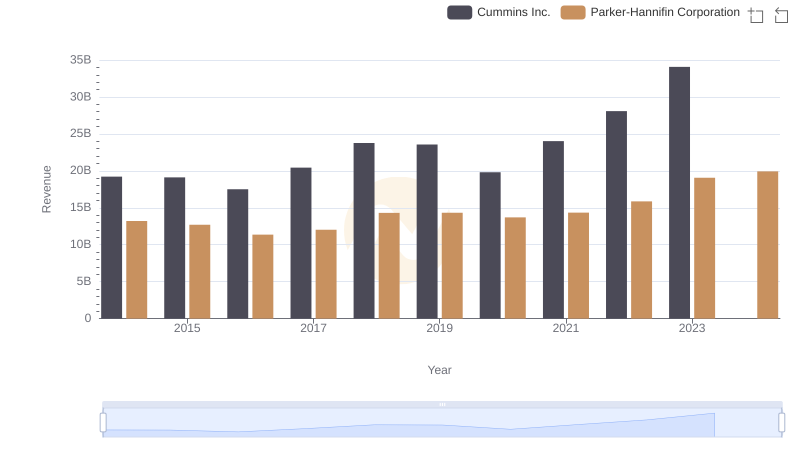
Parker-Hannifin Corporation vs Cummins Inc.: Examining Key Revenue Metrics
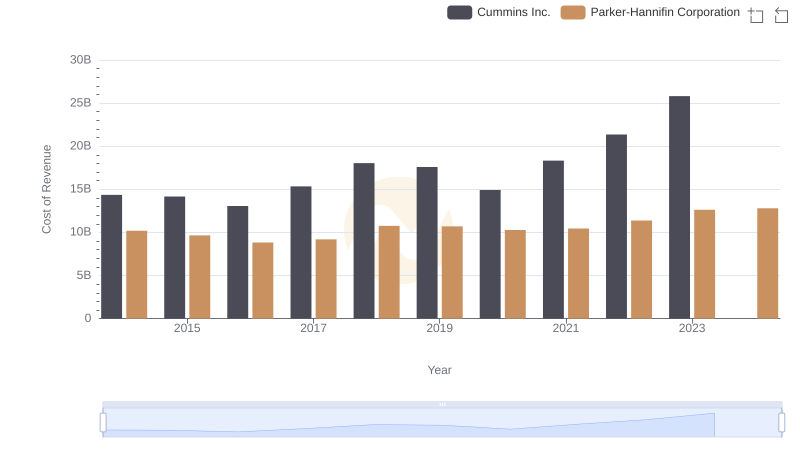
Analyzing Cost of Revenue: Parker-Hannifin Corporation and Cummins Inc.
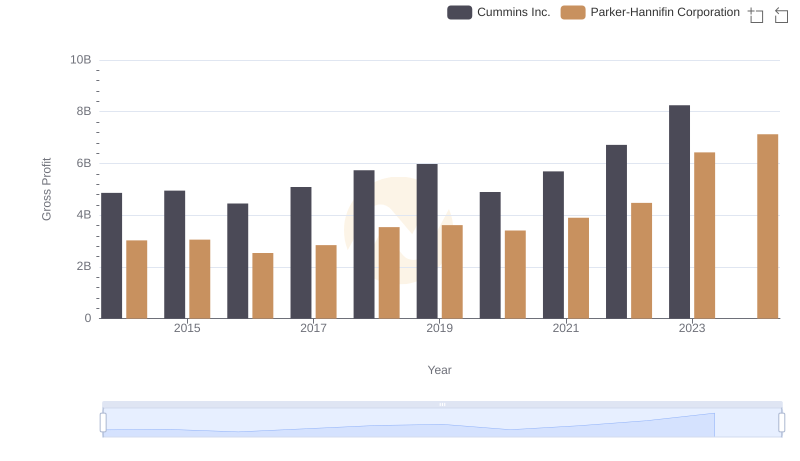
Gross Profit Trends Compared: Parker-Hannifin Corporation vs Cummins Inc.
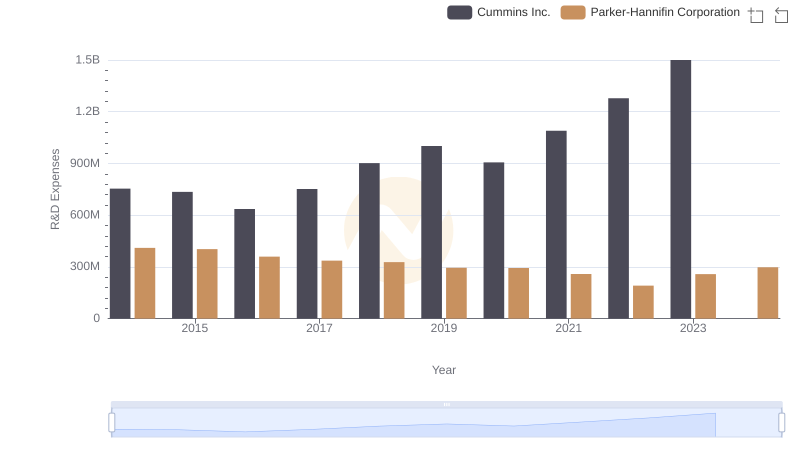
Parker-Hannifin Corporation vs Cummins Inc.: Strategic Focus on R&D Spending
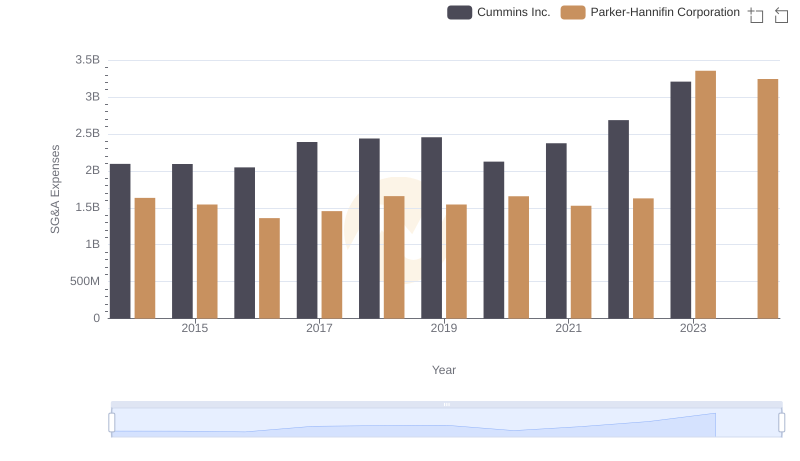
Selling, General, and Administrative Costs: Parker-Hannifin Corporation vs Cummins Inc.
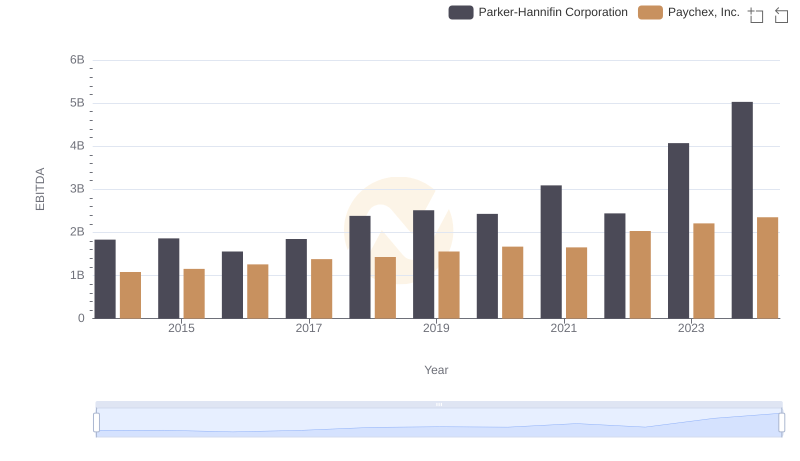
A Professional Review of EBITDA: Parker-Hannifin Corporation Compared to Paychex, Inc.
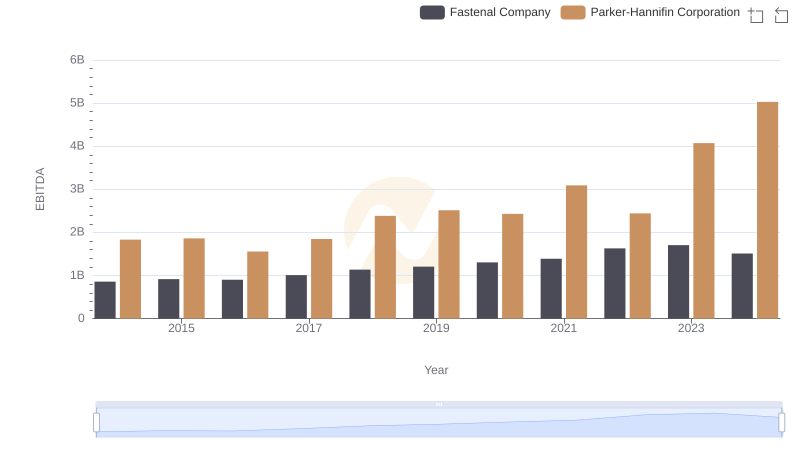
Parker-Hannifin Corporation and Fastenal Company: A Detailed Examination of EBITDA Performance
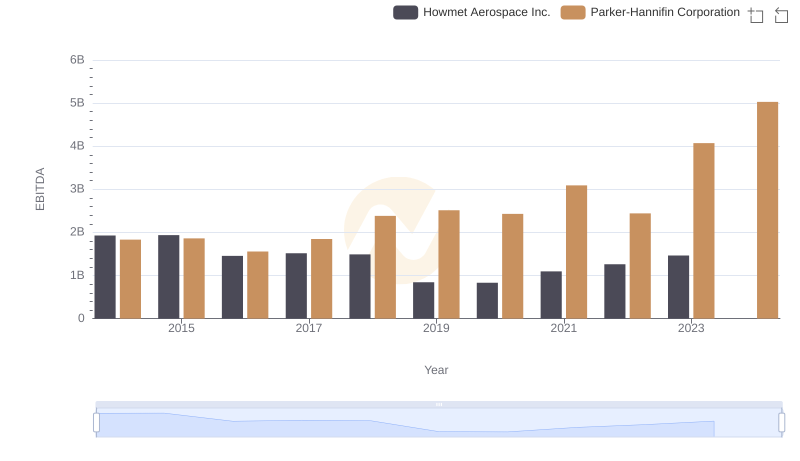
A Side-by-Side Analysis of EBITDA: Parker-Hannifin Corporation and Howmet Aerospace Inc.
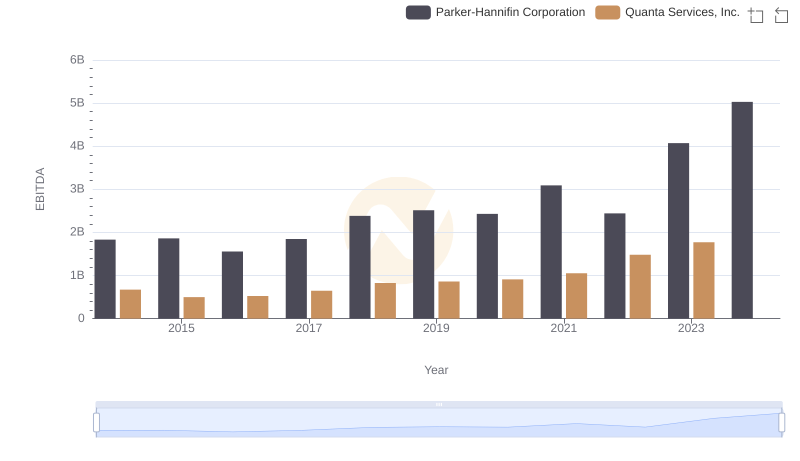
A Professional Review of EBITDA: Parker-Hannifin Corporation Compared to Quanta Services, Inc.
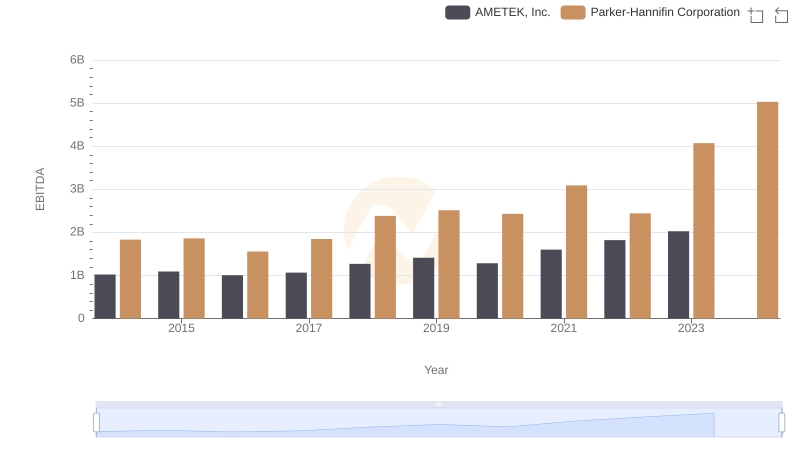
Parker-Hannifin Corporation and AMETEK, Inc.: A Detailed Examination of EBITDA Performance