| __timestamp | Cummins Inc. | Parker-Hannifin Corporation |
|---|---|---|
| Wednesday, January 1, 2014 | 4861000000 | 3027744000 |
| Thursday, January 1, 2015 | 4947000000 | 3056499000 |
| Friday, January 1, 2016 | 4452000000 | 2537369000 |
| Sunday, January 1, 2017 | 5090000000 | 2840350000 |
| Monday, January 1, 2018 | 5737000000 | 3539551000 |
| Tuesday, January 1, 2019 | 5980000000 | 3616840000 |
| Wednesday, January 1, 2020 | 4894000000 | 3409002000 |
| Friday, January 1, 2021 | 5695000000 | 3897960000 |
| Saturday, January 1, 2022 | 6719000000 | 4474341000 |
| Sunday, January 1, 2023 | 8249000000 | 6429302000 |
| Monday, January 1, 2024 | 8439000000 | 7127790000 |
Unleashing insights
In the competitive landscape of industrial manufacturing, Parker-Hannifin Corporation and Cummins Inc. have been pivotal players. Over the past decade, from 2014 to 2023, these giants have showcased intriguing trends in their gross profits. Cummins Inc. started with a gross profit of approximately $4.9 billion in 2014, experiencing a steady climb to a remarkable $8.2 billion by 2023, marking a growth of nearly 68%. Meanwhile, Parker-Hannifin Corporation, though starting lower at around $3 billion, saw its gross profit rise to $6.4 billion in 2023, more than doubling over the same period.
The year 2023 was particularly noteworthy, with both companies reaching their peak gross profits. However, data for 2024 is incomplete, leaving room for speculation on future trends. This analysis highlights the resilience and growth potential of these industrial titans in a dynamic market.
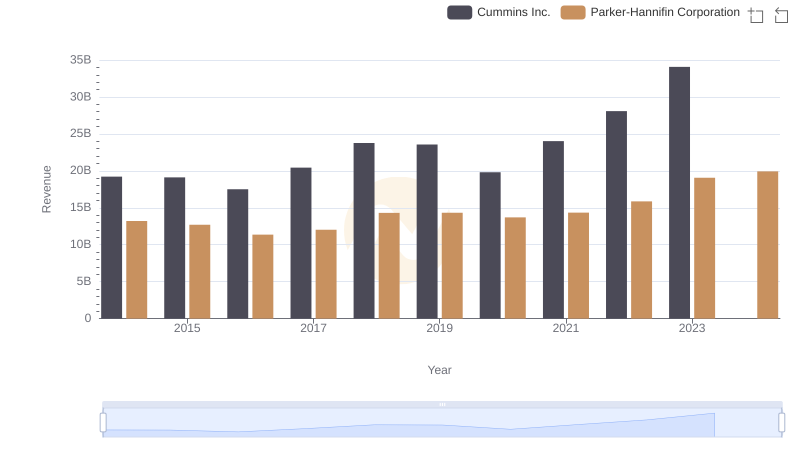
Parker-Hannifin Corporation vs Cummins Inc.: Examining Key Revenue Metrics
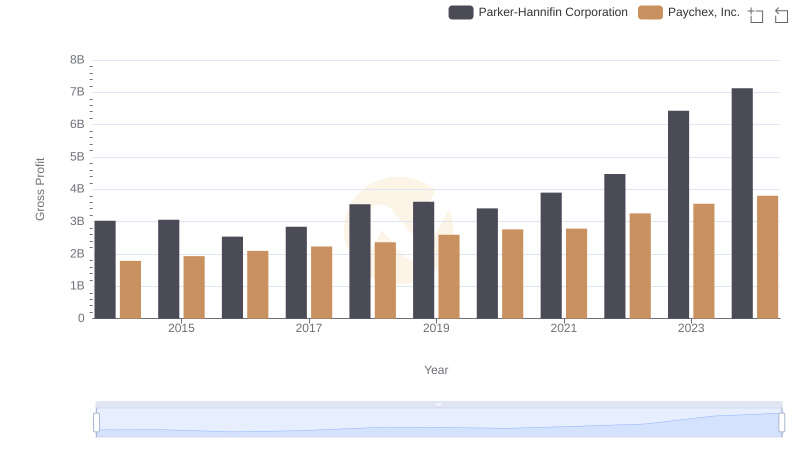
Who Generates Higher Gross Profit? Parker-Hannifin Corporation or Paychex, Inc.
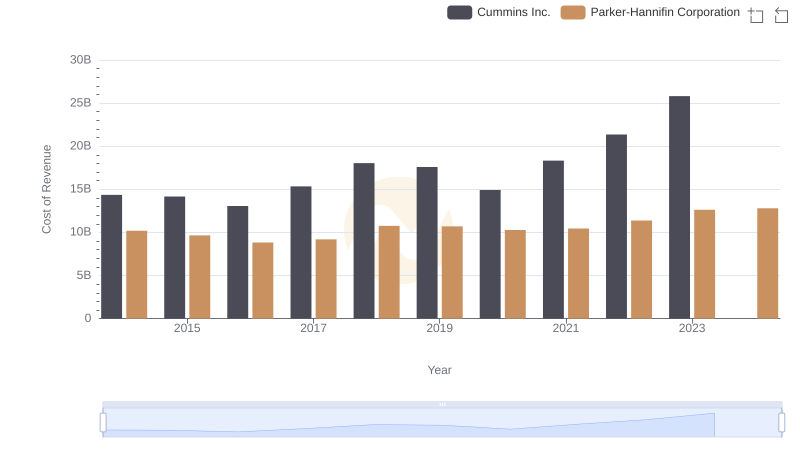
Analyzing Cost of Revenue: Parker-Hannifin Corporation and Cummins Inc.
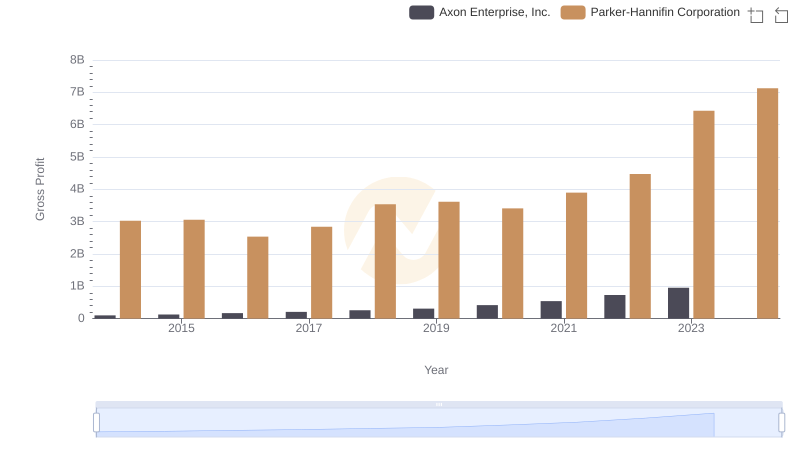
Gross Profit Comparison: Parker-Hannifin Corporation and Axon Enterprise, Inc. Trends
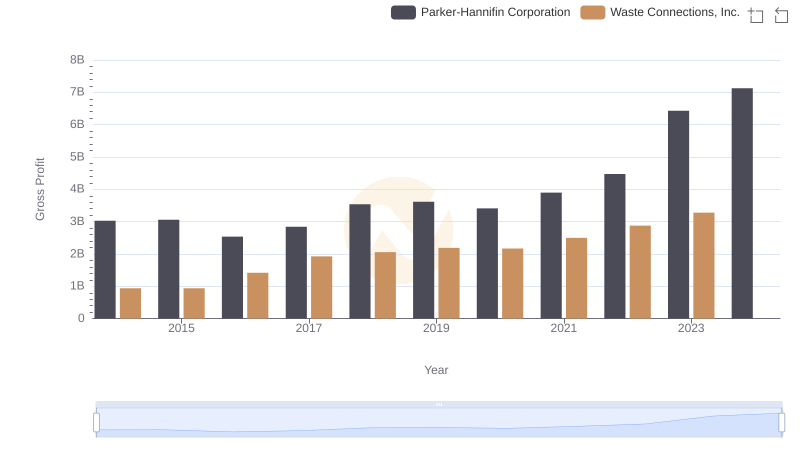
Parker-Hannifin Corporation vs Waste Connections, Inc.: A Gross Profit Performance Breakdown
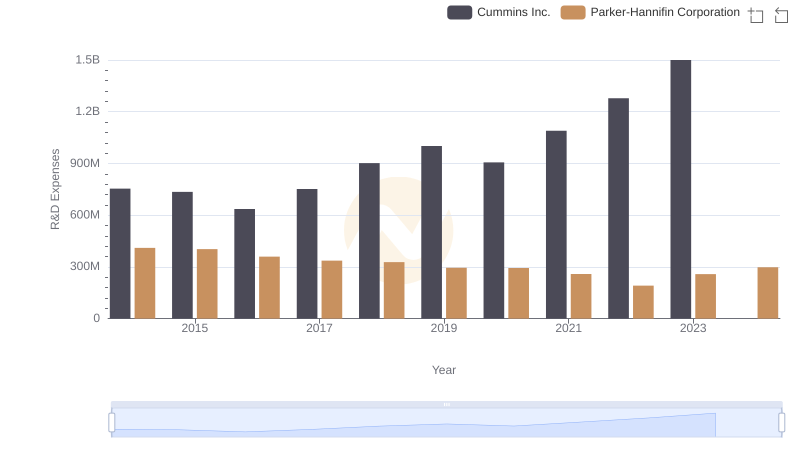
Parker-Hannifin Corporation vs Cummins Inc.: Strategic Focus on R&D Spending
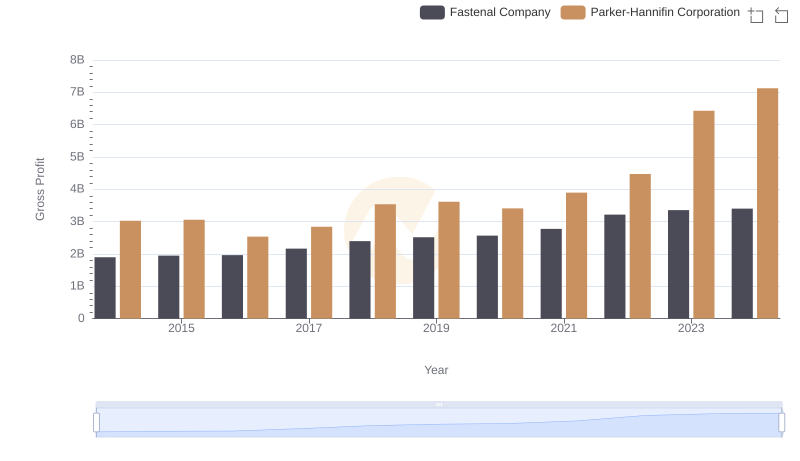
Key Insights on Gross Profit: Parker-Hannifin Corporation vs Fastenal Company
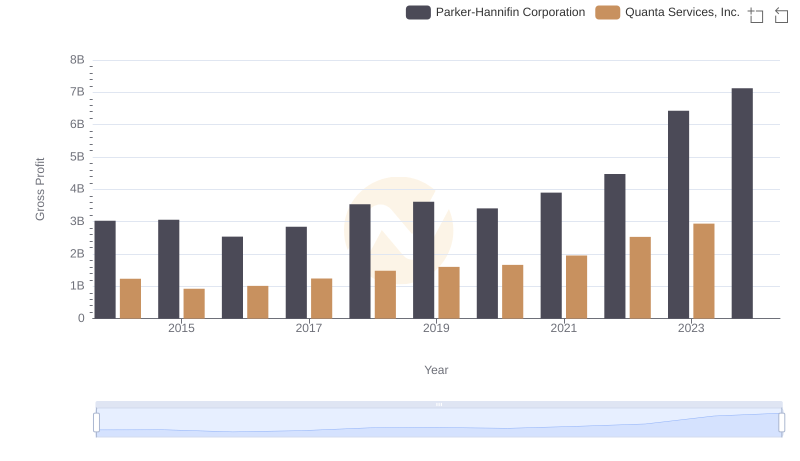
Key Insights on Gross Profit: Parker-Hannifin Corporation vs Quanta Services, Inc.
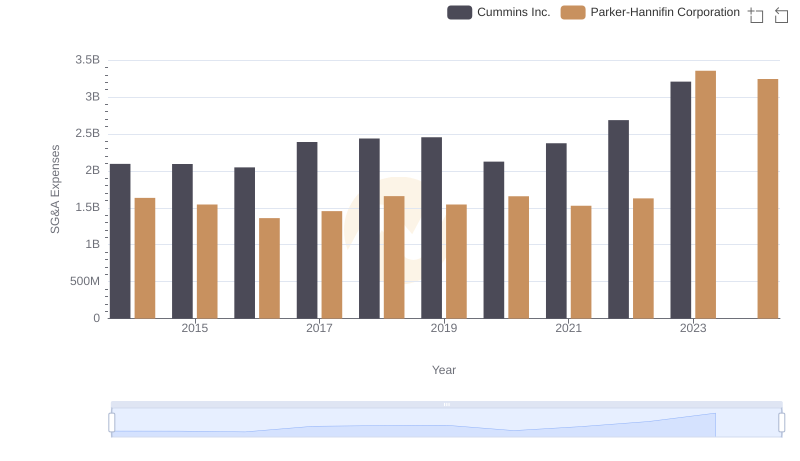
Selling, General, and Administrative Costs: Parker-Hannifin Corporation vs Cummins Inc.
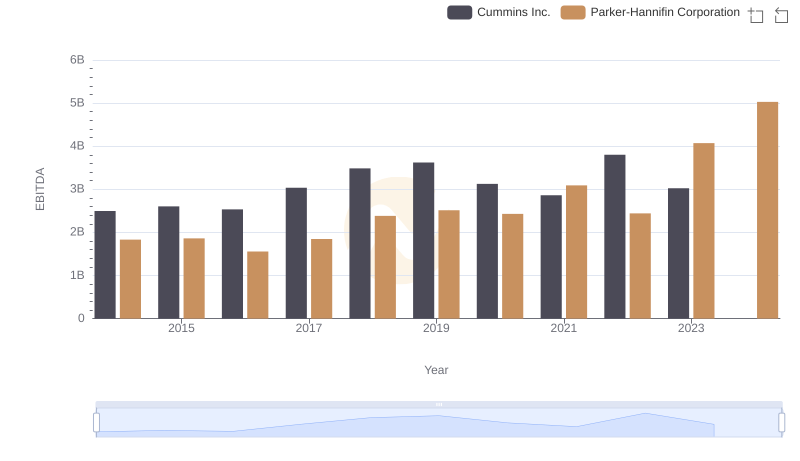
A Professional Review of EBITDA: Parker-Hannifin Corporation Compared to Cummins Inc.