| __timestamp | Cummins Inc. | Parker-Hannifin Corporation |
|---|---|---|
| Wednesday, January 1, 2014 | 14360000000 | 10188227000 |
| Thursday, January 1, 2015 | 14163000000 | 9655245000 |
| Friday, January 1, 2016 | 13057000000 | 8823384000 |
| Sunday, January 1, 2017 | 15338000000 | 9188962000 |
| Monday, January 1, 2018 | 18034000000 | 10762841000 |
| Tuesday, January 1, 2019 | 17591000000 | 10703484000 |
| Wednesday, January 1, 2020 | 14917000000 | 10286518000 |
| Friday, January 1, 2021 | 18326000000 | 10449680000 |
| Saturday, January 1, 2022 | 21355000000 | 11387267000 |
| Sunday, January 1, 2023 | 25816000000 | 12635892000 |
| Monday, January 1, 2024 | 25663000000 | 12801816000 |
Cracking the code
In the competitive landscape of industrial manufacturing, Parker-Hannifin Corporation and Cummins Inc. have been pivotal players. Over the past decade, from 2014 to 2023, these companies have shown distinct trends in their cost of revenue, a critical metric reflecting the direct costs attributable to the production of goods sold by a company.
Cummins Inc. has experienced a significant upward trajectory, with its cost of revenue increasing by approximately 80% from 2014 to 2023. This growth highlights Cummins' expanding operations and market reach. In contrast, Parker-Hannifin Corporation has seen a more modest increase of around 24% over the same period, indicating a steady yet controlled expansion.
Interestingly, the data for 2024 shows a missing value for Cummins Inc., suggesting potential data collection issues or strategic changes. This analysis provides a snapshot of how these industrial titans manage their production costs in a dynamic market.
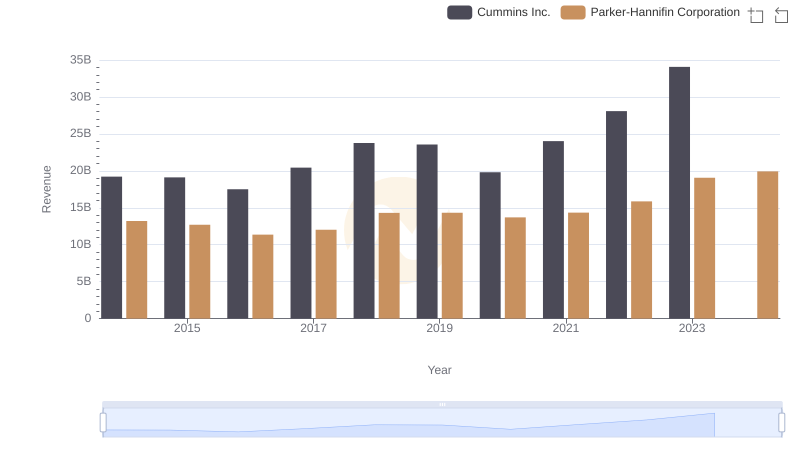
Parker-Hannifin Corporation vs Cummins Inc.: Examining Key Revenue Metrics
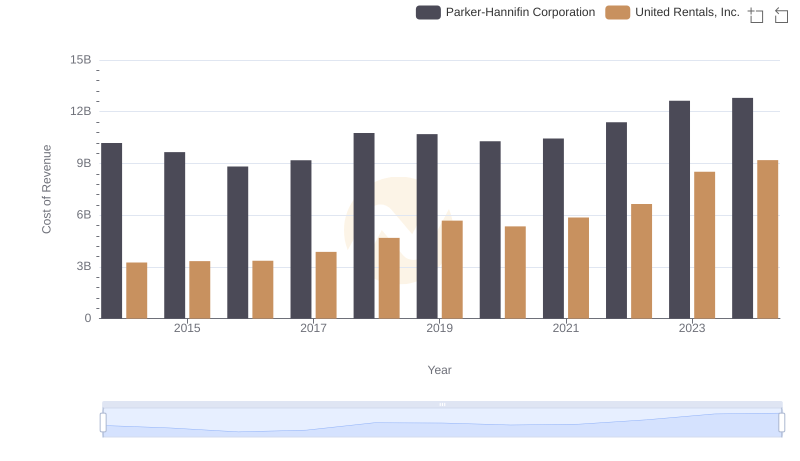
Analyzing Cost of Revenue: Parker-Hannifin Corporation and United Rentals, Inc.
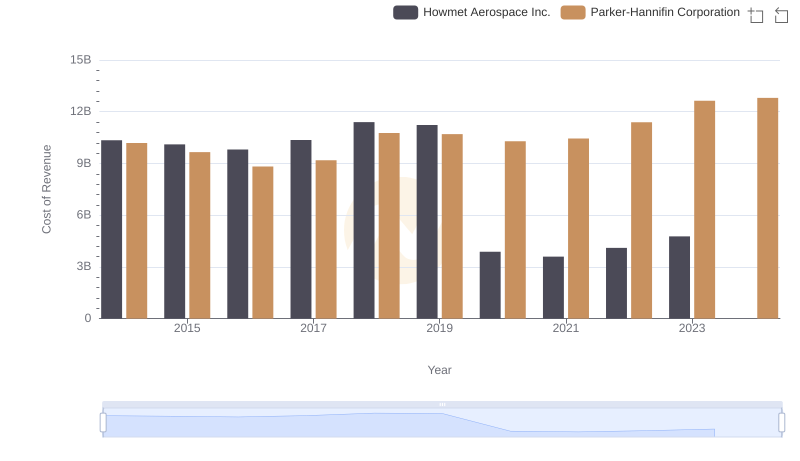
Analyzing Cost of Revenue: Parker-Hannifin Corporation and Howmet Aerospace Inc.
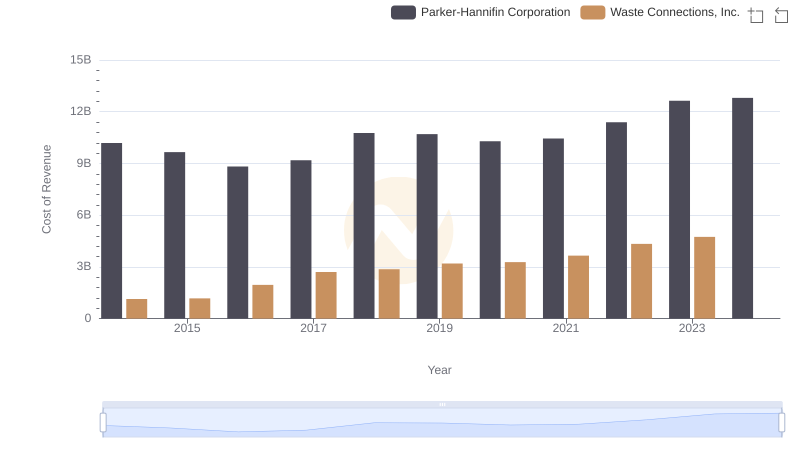
Cost Insights: Breaking Down Parker-Hannifin Corporation and Waste Connections, Inc.'s Expenses
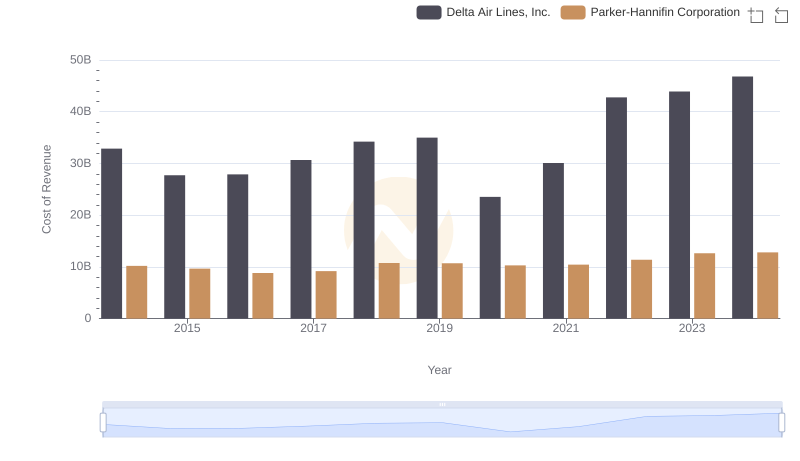
Cost of Revenue Trends: Parker-Hannifin Corporation vs Delta Air Lines, Inc.
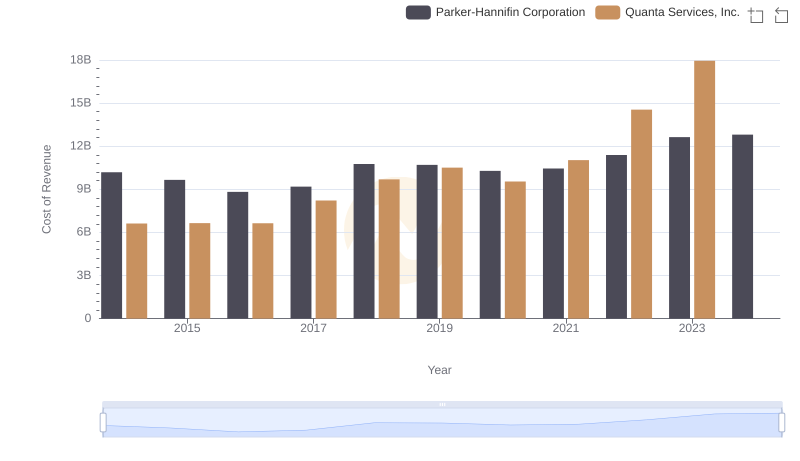
Parker-Hannifin Corporation vs Quanta Services, Inc.: Efficiency in Cost of Revenue Explored
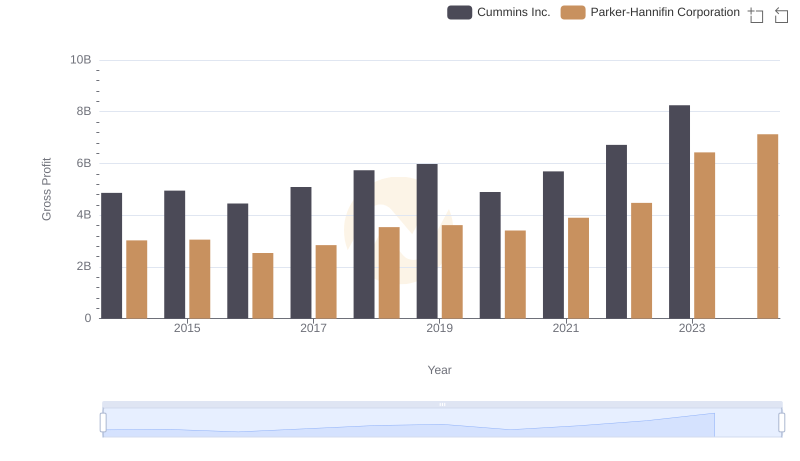
Gross Profit Trends Compared: Parker-Hannifin Corporation vs Cummins Inc.
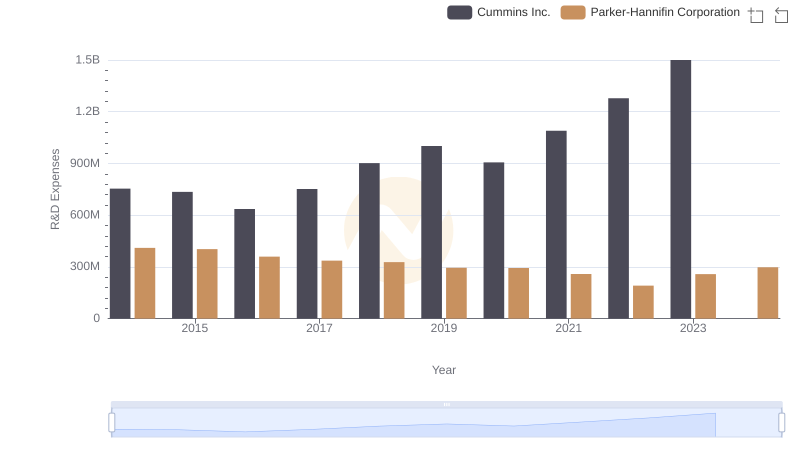
Parker-Hannifin Corporation vs Cummins Inc.: Strategic Focus on R&D Spending
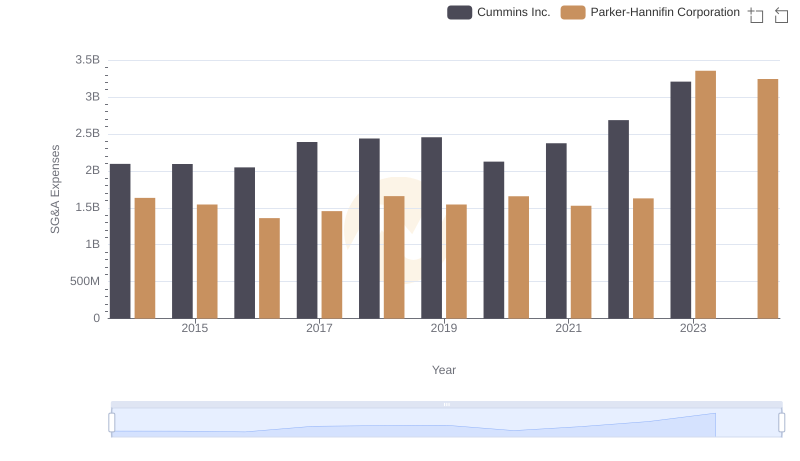
Selling, General, and Administrative Costs: Parker-Hannifin Corporation vs Cummins Inc.
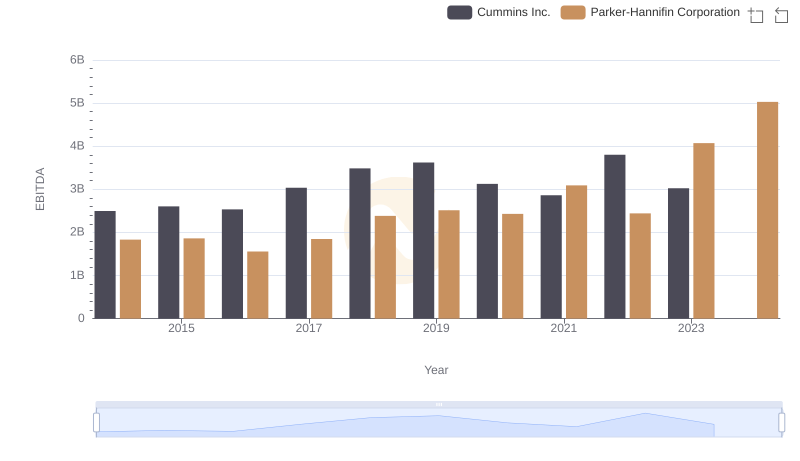
A Professional Review of EBITDA: Parker-Hannifin Corporation Compared to Cummins Inc.