| __timestamp | Parker-Hannifin Corporation | Quanta Services, Inc. |
|---|---|---|
| Wednesday, January 1, 2014 | 1633992000 | 580730000 |
| Thursday, January 1, 2015 | 1544746000 | 592863000 |
| Friday, January 1, 2016 | 1359360000 | 653338000 |
| Sunday, January 1, 2017 | 1453935000 | 777920000 |
| Monday, January 1, 2018 | 1657152000 | 857574000 |
| Tuesday, January 1, 2019 | 1543939000 | 955991000 |
| Wednesday, January 1, 2020 | 1656553000 | 975074000 |
| Friday, January 1, 2021 | 1527302000 | 1155956000 |
| Saturday, January 1, 2022 | 1627116000 | 1336711000 |
| Sunday, January 1, 2023 | 3354103000 | 1555137000 |
| Monday, January 1, 2024 | 3315177000 |
Data in motion
In the ever-evolving landscape of industrial giants, Parker-Hannifin Corporation and Quanta Services, Inc. have showcased intriguing trends in their Selling, General, and Administrative (SG&A) expenses over the past decade. From 2014 to 2023, Parker-Hannifin's SG&A expenses have seen a remarkable increase, peaking in 2023 with a staggering 105% rise compared to 2014. This surge reflects strategic investments and expansions, positioning Parker-Hannifin as a formidable player in the industry.
Conversely, Quanta Services has demonstrated a steady upward trajectory, with a 168% increase in SG&A expenses from 2014 to 2023. This growth underscores Quanta's commitment to scaling operations and enhancing service delivery. However, data for 2024 remains elusive, leaving room for speculation on future trends.
These insights offer a glimpse into the financial strategies of two industry leaders, highlighting their adaptive approaches in a competitive market.
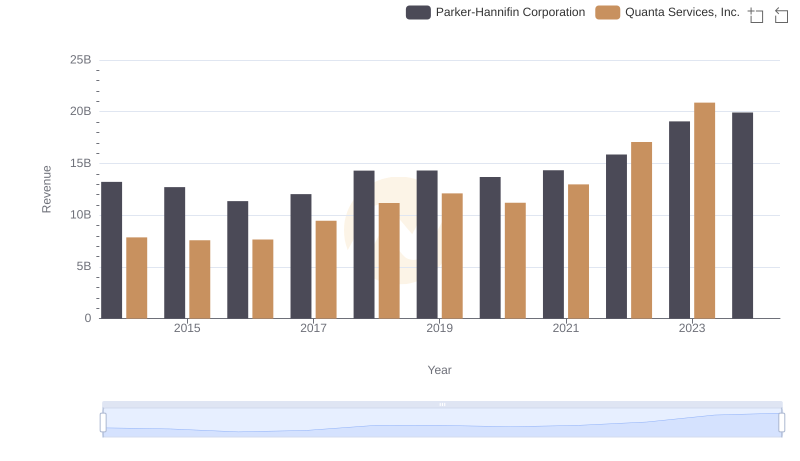
Comparing Revenue Performance: Parker-Hannifin Corporation or Quanta Services, Inc.?
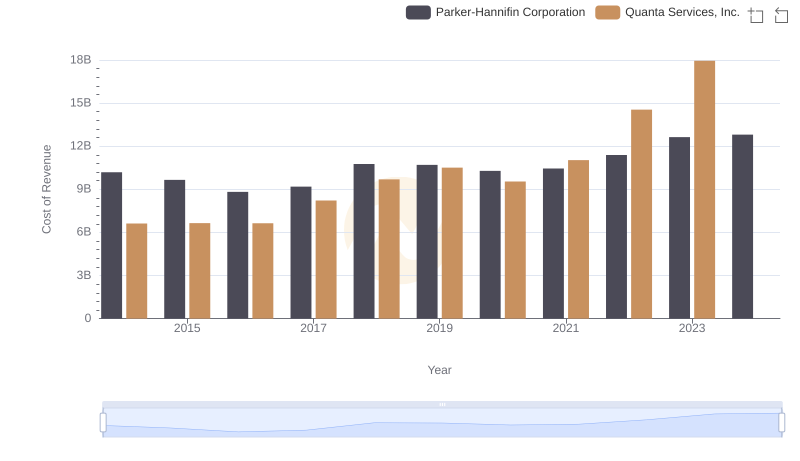
Parker-Hannifin Corporation vs Quanta Services, Inc.: Efficiency in Cost of Revenue Explored
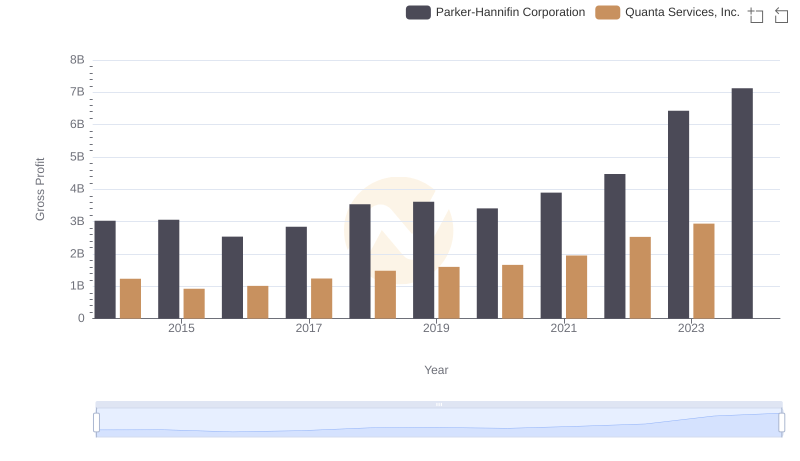
Key Insights on Gross Profit: Parker-Hannifin Corporation vs Quanta Services, Inc.
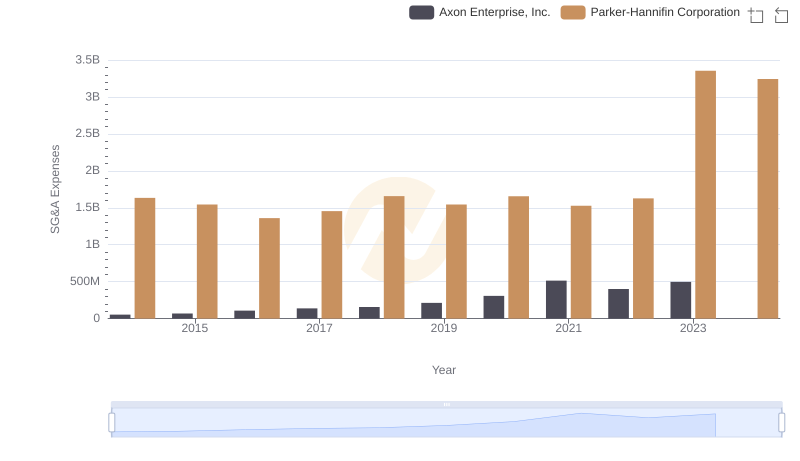
Selling, General, and Administrative Costs: Parker-Hannifin Corporation vs Axon Enterprise, Inc.
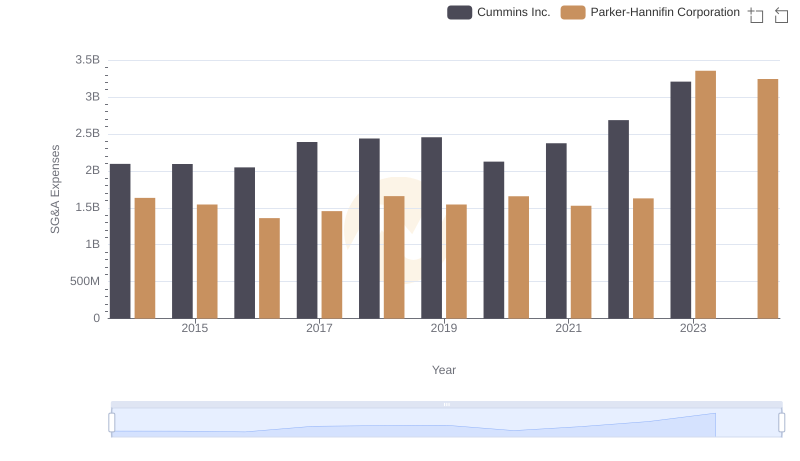
Selling, General, and Administrative Costs: Parker-Hannifin Corporation vs Cummins Inc.
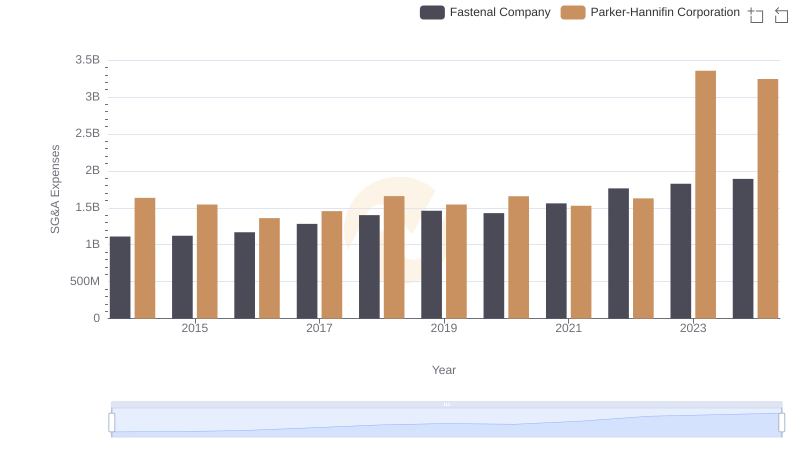
Cost Management Insights: SG&A Expenses for Parker-Hannifin Corporation and Fastenal Company
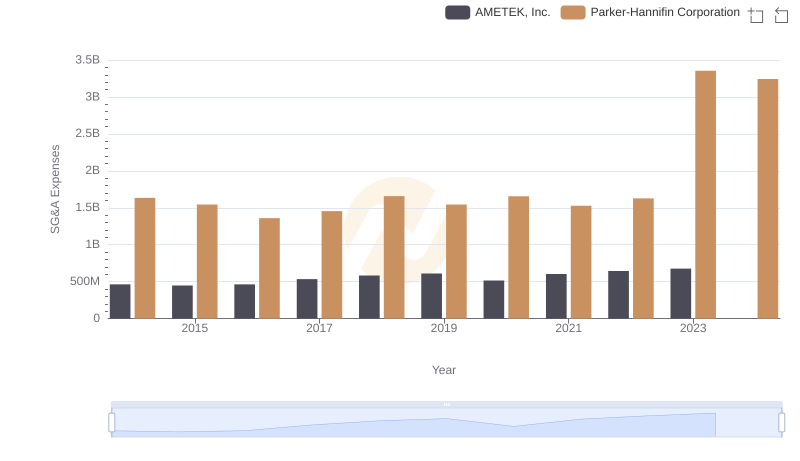
Selling, General, and Administrative Costs: Parker-Hannifin Corporation vs AMETEK, Inc.

Cost Management Insights: SG&A Expenses for Parker-Hannifin Corporation and Old Dominion Freight Line, Inc.
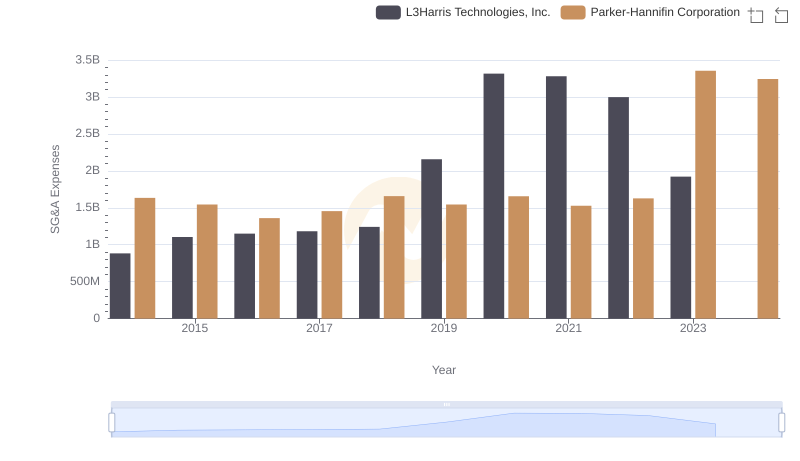
Who Optimizes SG&A Costs Better? Parker-Hannifin Corporation or L3Harris Technologies, Inc.
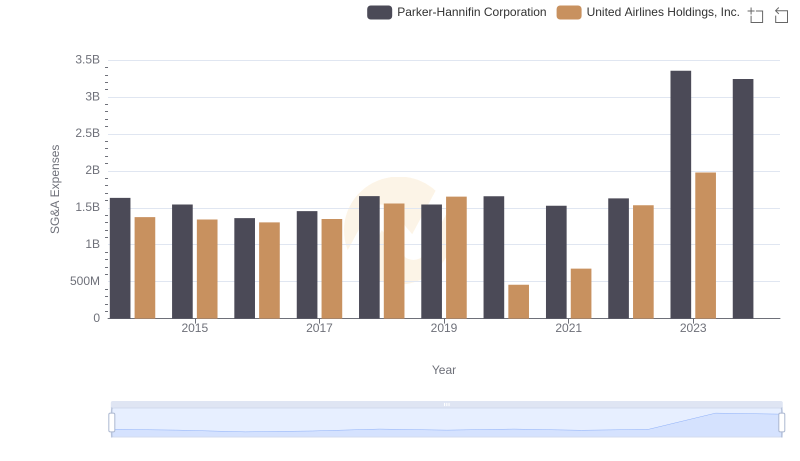
Selling, General, and Administrative Costs: Parker-Hannifin Corporation vs United Airlines Holdings, Inc.
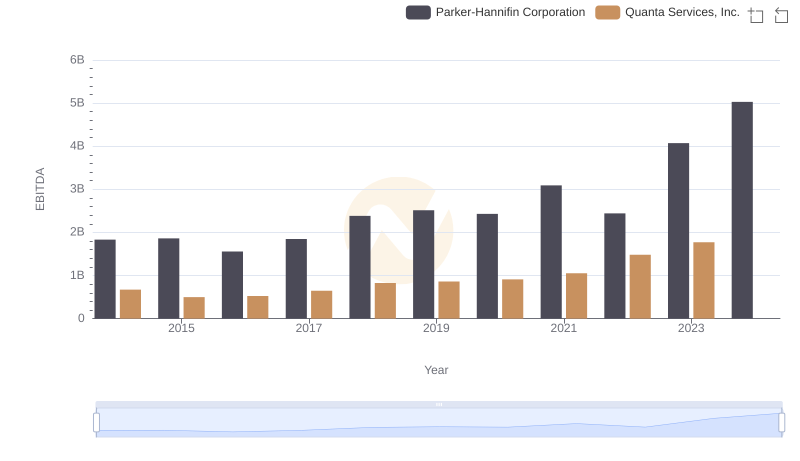
A Professional Review of EBITDA: Parker-Hannifin Corporation Compared to Quanta Services, Inc.