| __timestamp | International Business Machines Corporation | Splunk Inc. |
|---|---|---|
| Wednesday, January 1, 2014 | 92793000000 | 302623000 |
| Thursday, January 1, 2015 | 81742000000 | 450875000 |
| Friday, January 1, 2016 | 79920000000 | 668435000 |
| Sunday, January 1, 2017 | 79139000000 | 949955000 |
| Monday, January 1, 2018 | 79591000000 | 1270788000 |
| Tuesday, January 1, 2019 | 57714000000 | 1803010000 |
| Wednesday, January 1, 2020 | 55179000000 | 2358926000 |
| Friday, January 1, 2021 | 57351000000 | 2229385000 |
| Saturday, January 1, 2022 | 60530000000 | 2673664000 |
| Sunday, January 1, 2023 | 61860000000 | 3653708000 |
| Monday, January 1, 2024 | 62753000000 | 4215595000 |
Unleashing insights
In the ever-evolving landscape of technology, revenue performance is a key indicator of a company's market position and growth potential. This chart offers a fascinating glimpse into the revenue trajectories of two tech titans: International Business Machines Corporation (IBM) and Splunk Inc., from 2014 to 2024.
IBM, a stalwart in the tech industry, has seen its revenue decline by approximately 32% over the decade, from its peak in 2014. Despite this, IBM remains a formidable force, with revenues still towering over Splunk's by a factor of nearly 15 in 2024.
Conversely, Splunk, a leader in data analytics, has experienced a remarkable revenue growth of over 1,300% during the same period. This growth underscores Splunk's rising influence in the tech sector, as it continues to innovate and expand its market reach.
This comparison highlights the dynamic nature of the tech industry, where established giants and agile newcomers coexist and compete.
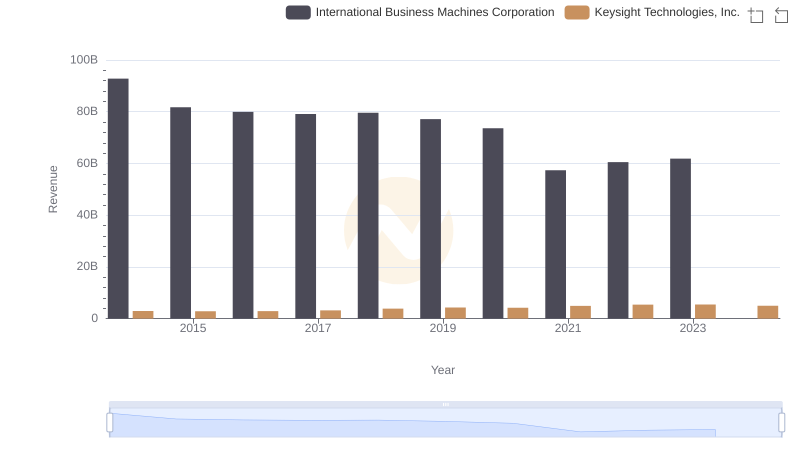
International Business Machines Corporation or Keysight Technologies, Inc.: Who Leads in Yearly Revenue?
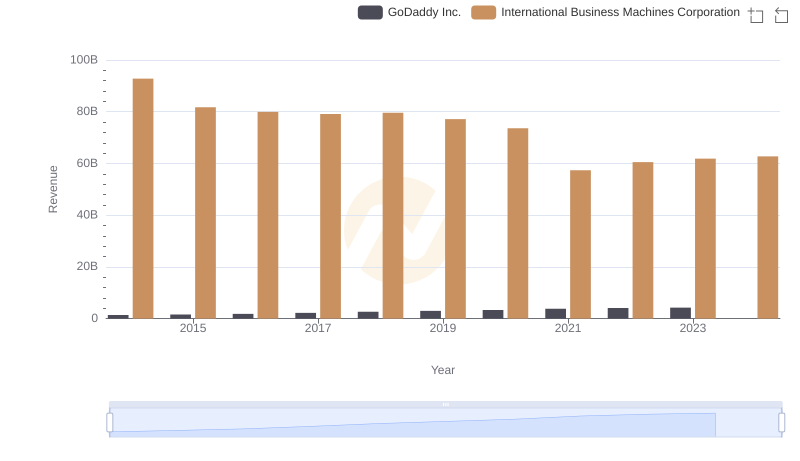
Who Generates More Revenue? International Business Machines Corporation or GoDaddy Inc.
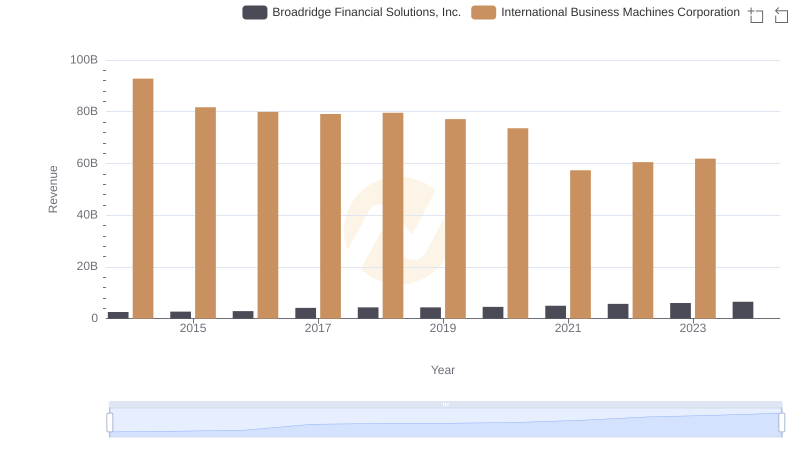
Revenue Insights: International Business Machines Corporation and Broadridge Financial Solutions, Inc. Performance Compared
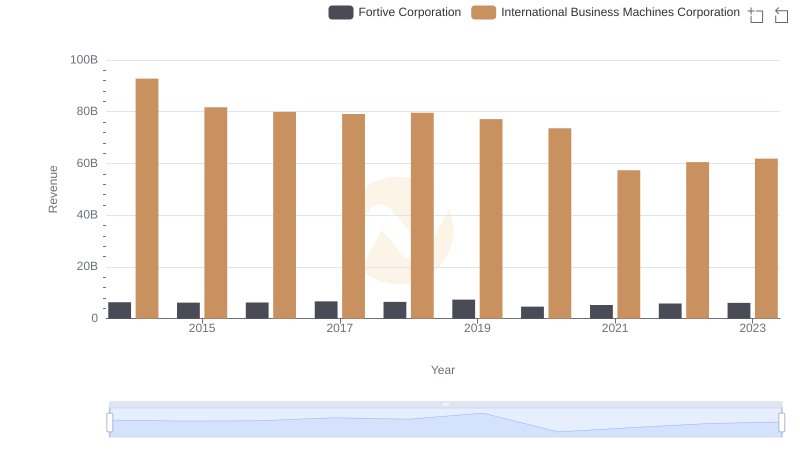
Annual Revenue Comparison: International Business Machines Corporation vs Fortive Corporation
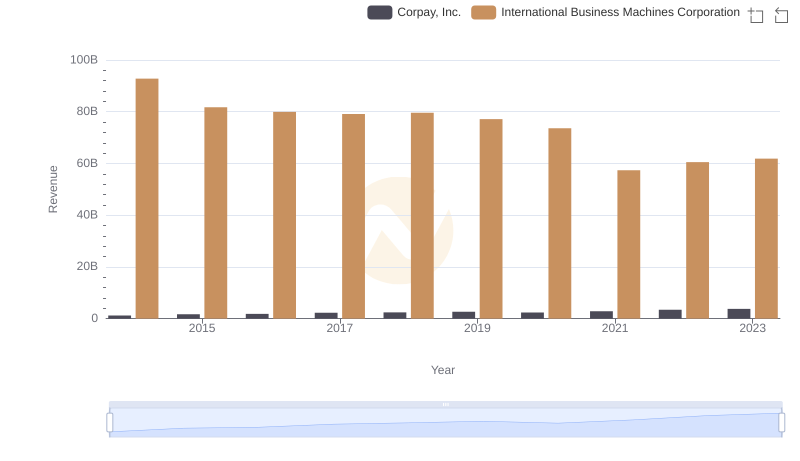
Comparing Revenue Performance: International Business Machines Corporation or Corpay, Inc.?
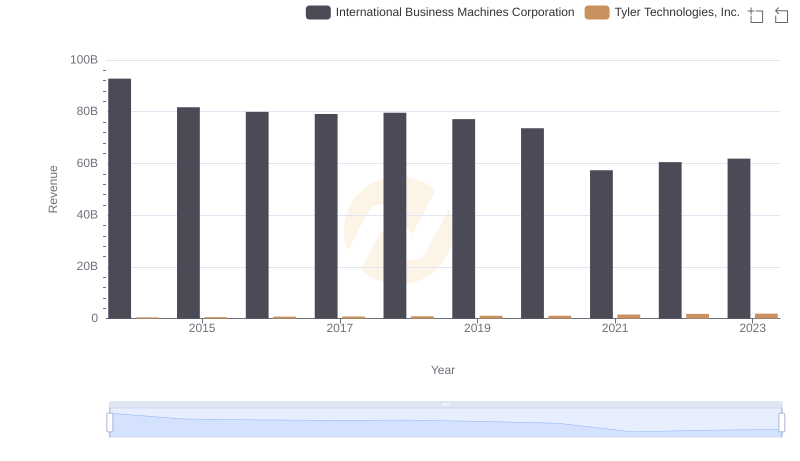
International Business Machines Corporation vs Tyler Technologies, Inc.: Examining Key Revenue Metrics
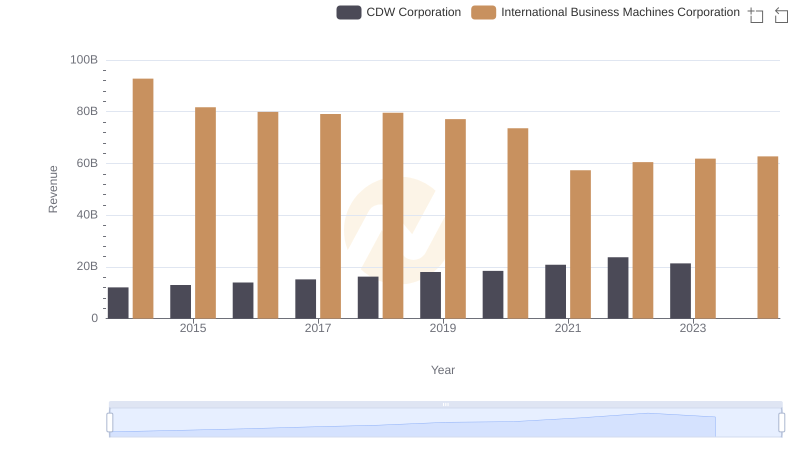
Who Generates More Revenue? International Business Machines Corporation or CDW Corporation
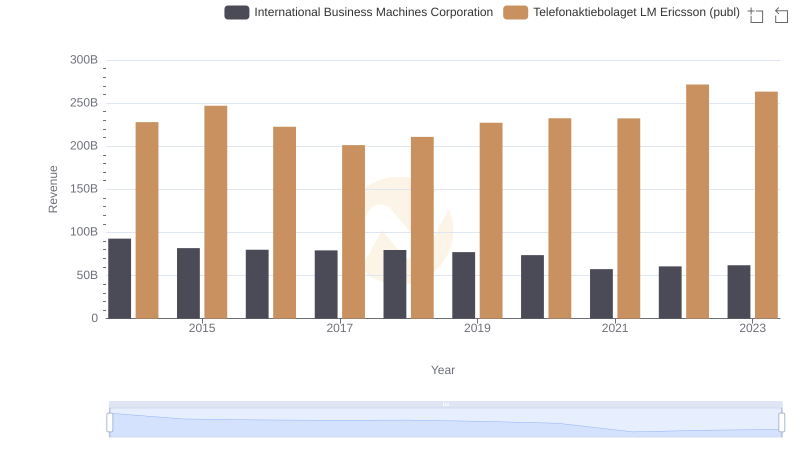
Comparing Revenue Performance: International Business Machines Corporation or Telefonaktiebolaget LM Ericsson (publ)?
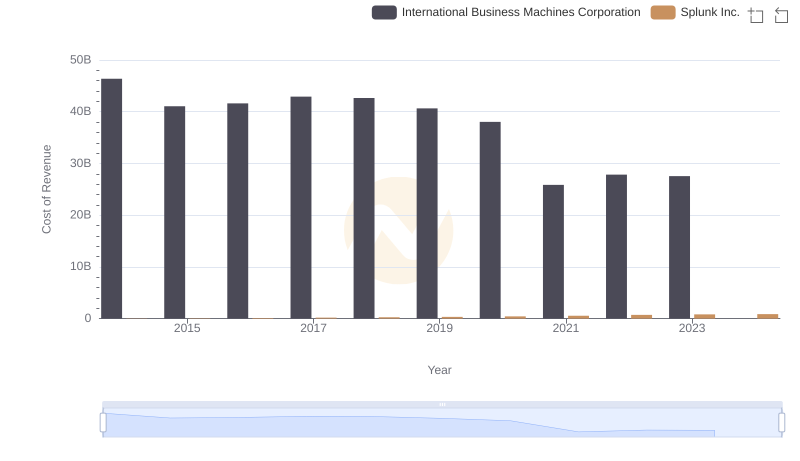
Cost of Revenue Comparison: International Business Machines Corporation vs Splunk Inc.
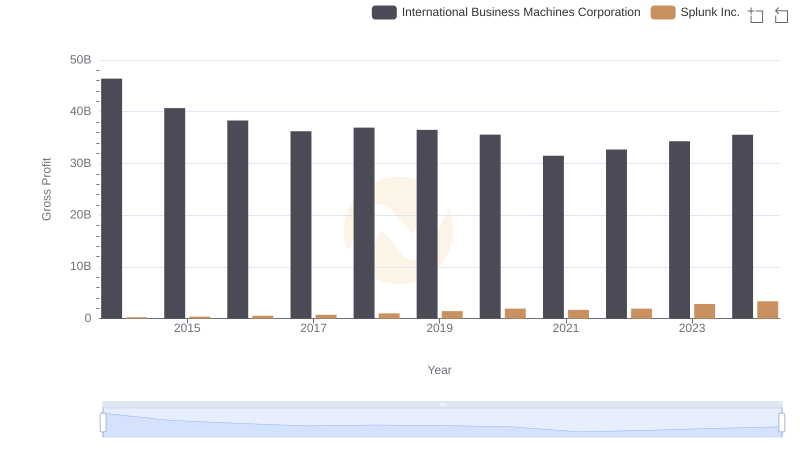
Gross Profit Trends Compared: International Business Machines Corporation vs Splunk Inc.
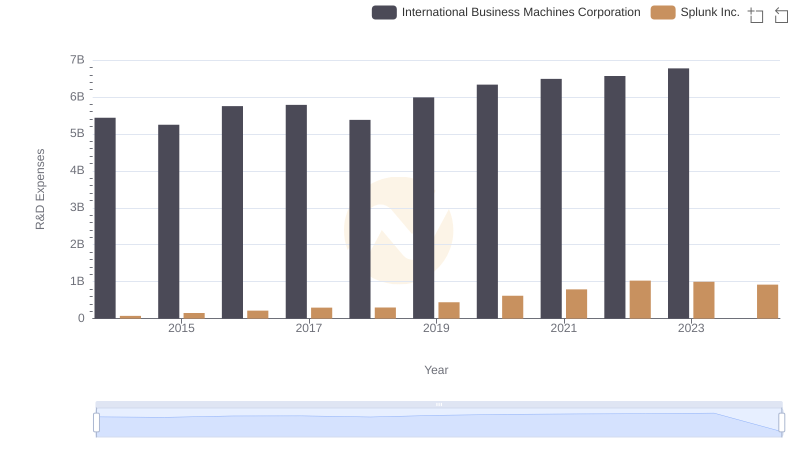
Comparing Innovation Spending: International Business Machines Corporation and Splunk Inc.
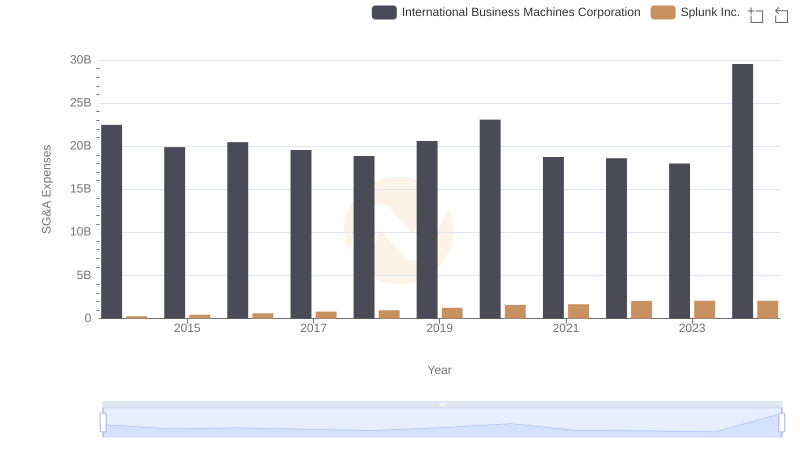
Selling, General, and Administrative Costs: International Business Machines Corporation vs Splunk Inc.