| __timestamp | Ferrovial SE | Rockwell Automation, Inc. |
|---|---|---|
| Wednesday, January 1, 2014 | 7671000000 | 2753900000 |
| Thursday, January 1, 2015 | 8556000000 | 2703100000 |
| Friday, January 1, 2016 | 9491000000 | 2475500000 |
| Sunday, January 1, 2017 | 10864000000 | 2624200000 |
| Monday, January 1, 2018 | 4752000000 | 2872200000 |
| Tuesday, January 1, 2019 | 5105000000 | 2900100000 |
| Wednesday, January 1, 2020 | 5336000000 | 2595200000 |
| Friday, January 1, 2021 | 5701000000 | 2897700000 |
| Saturday, January 1, 2022 | 6354000000 | 3102000000 |
| Sunday, January 1, 2023 | 7385000000 | 3717000000 |
| Monday, January 1, 2024 | 3193400000 |
Unleashing the power of data
In the ever-evolving landscape of global industry, Rockwell Automation, Inc. and Ferrovial SE stand as titans in their respective fields. Over the past decade, Ferrovial SE has consistently outperformed Rockwell Automation in terms of gross profit, with an average of 7.1 billion compared to Rockwell's 2.9 billion. However, Rockwell Automation has shown a steady growth trajectory, with a notable 30% increase in gross profit from 2014 to 2023. Ferrovial SE, despite a dip in 2018, has maintained a robust growth pattern, peaking in 2017 with a gross profit of over 10 billion. The data for 2024 is incomplete, leaving room for speculation on future trends. This comparison not only highlights the financial prowess of these companies but also underscores the dynamic nature of global markets.
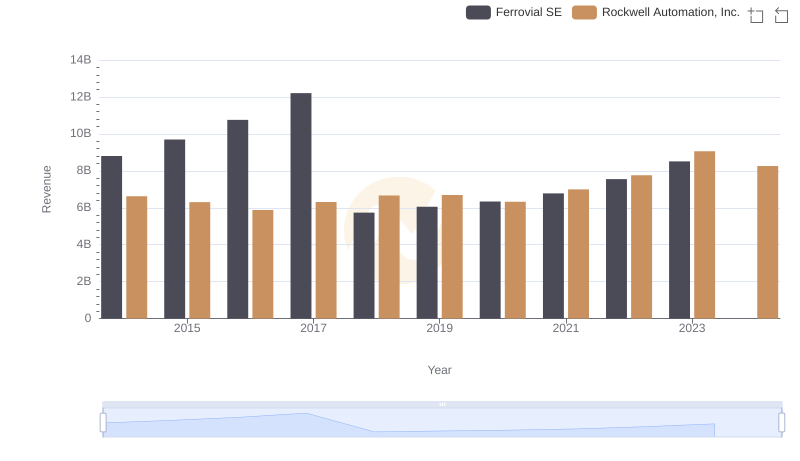
Breaking Down Revenue Trends: Rockwell Automation, Inc. vs Ferrovial SE
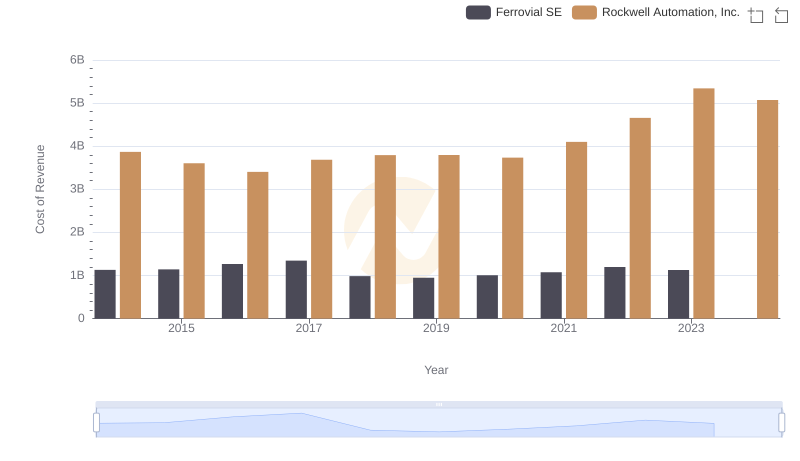
Comparing Cost of Revenue Efficiency: Rockwell Automation, Inc. vs Ferrovial SE
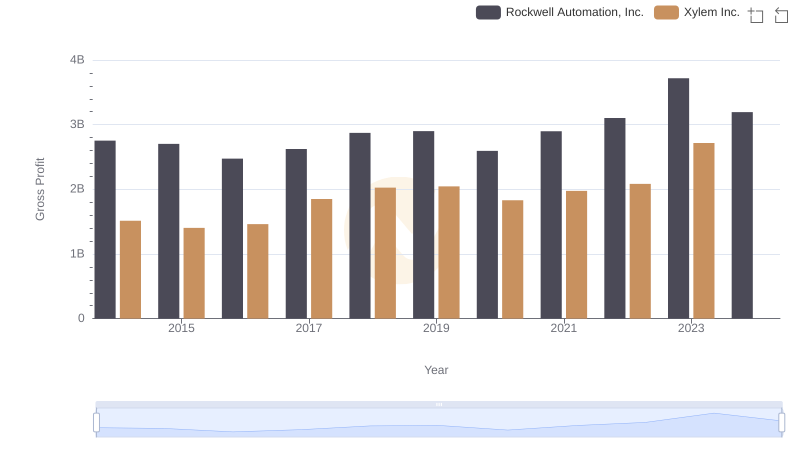
Gross Profit Comparison: Rockwell Automation, Inc. and Xylem Inc. Trends
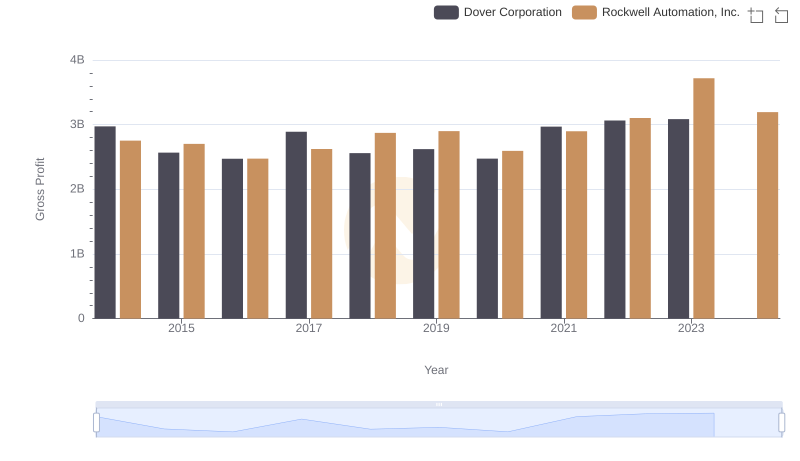
Gross Profit Analysis: Comparing Rockwell Automation, Inc. and Dover Corporation
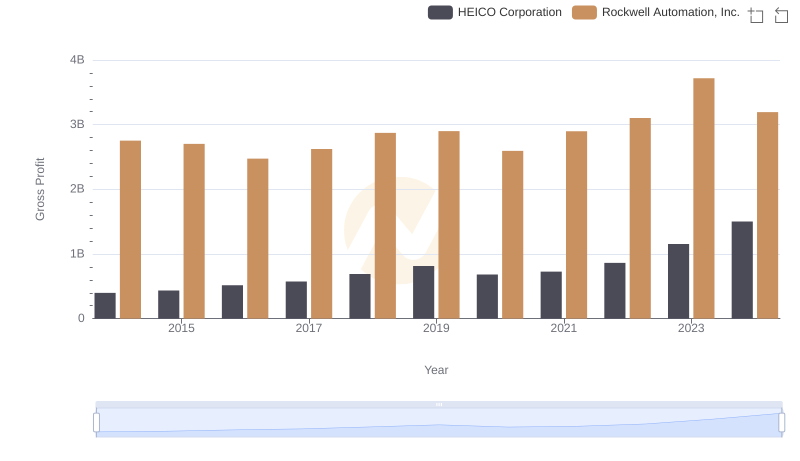
Gross Profit Analysis: Comparing Rockwell Automation, Inc. and HEICO Corporation
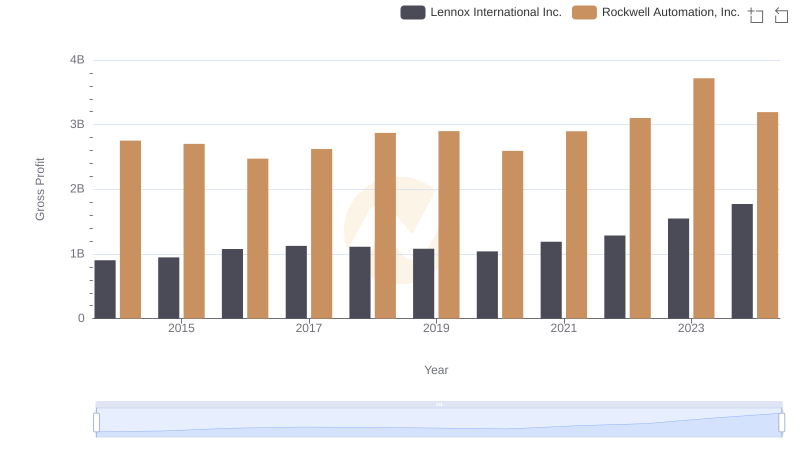
Rockwell Automation, Inc. vs Lennox International Inc.: A Gross Profit Performance Breakdown

Key Insights on Gross Profit: Rockwell Automation, Inc. vs Hubbell Incorporated
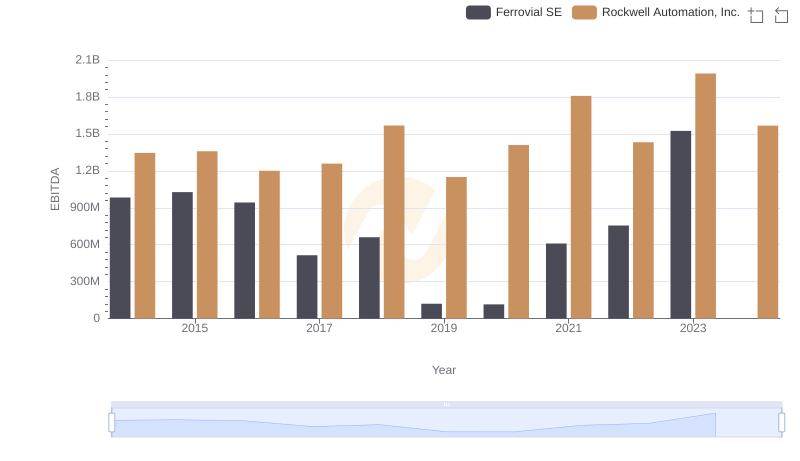
Rockwell Automation, Inc. vs Ferrovial SE: In-Depth EBITDA Performance Comparison
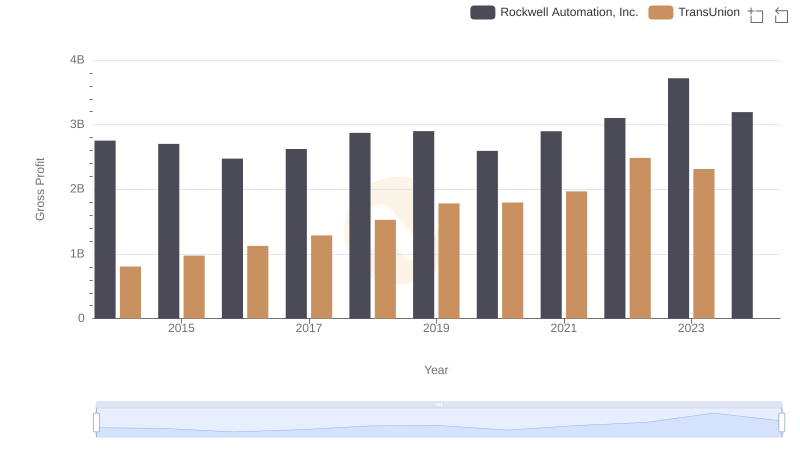
Rockwell Automation, Inc. and TransUnion: A Detailed Gross Profit Analysis