| __timestamp | EMCOR Group, Inc. | Rockwell Automation, Inc. |
|---|---|---|
| Wednesday, January 1, 2014 | 5517719000 | 3869600000 |
| Thursday, January 1, 2015 | 5774247000 | 3604800000 |
| Friday, January 1, 2016 | 6513662000 | 3404000000 |
| Sunday, January 1, 2017 | 6539987000 | 3687100000 |
| Monday, January 1, 2018 | 6925178000 | 3793800000 |
| Tuesday, January 1, 2019 | 7818743000 | 3794700000 |
| Wednesday, January 1, 2020 | 7401679000 | 3734600000 |
| Friday, January 1, 2021 | 8401843000 | 4099700000 |
| Saturday, January 1, 2022 | 9472526000 | 4658400000 |
| Sunday, January 1, 2023 | 10493534000 | 5341000000 |
| Monday, January 1, 2024 | 5070800000 |
Unlocking the unknown
In the ever-evolving landscape of industrial automation and construction services, Rockwell Automation, Inc. and EMCOR Group, Inc. stand as titans. Over the past decade, from 2014 to 2023, these companies have showcased distinct trajectories in their cost of revenue. EMCOR Group, Inc. has seen a robust growth of approximately 90%, peaking in 2023, while Rockwell Automation, Inc. experienced a more modest increase of around 38% over the same period.
EMCOR's cost of revenue surged from $5.5 billion in 2014 to an impressive $10.5 billion in 2023, reflecting its expanding footprint in the construction and facilities services sector. In contrast, Rockwell Automation's cost of revenue rose from $3.9 billion to $5.3 billion, highlighting its steady growth in the automation industry.
As we move into 2024, Rockwell Automation's data remains incomplete, leaving room for speculation on its future trajectory.
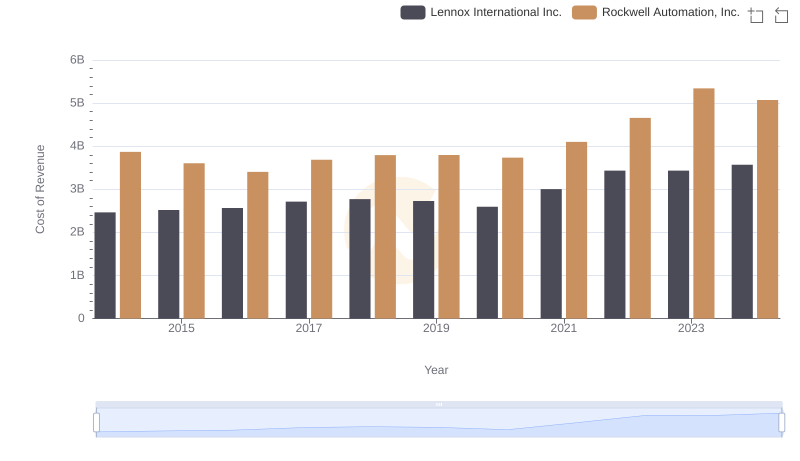
Cost of Revenue Trends: Rockwell Automation, Inc. vs Lennox International Inc.
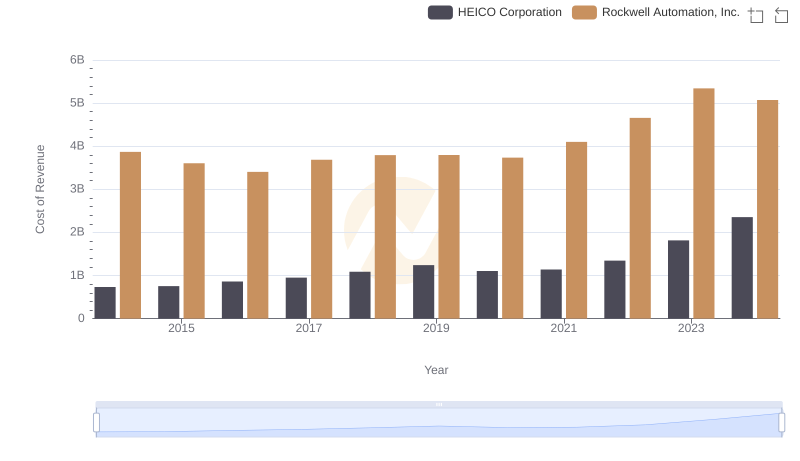
Analyzing Cost of Revenue: Rockwell Automation, Inc. and HEICO Corporation
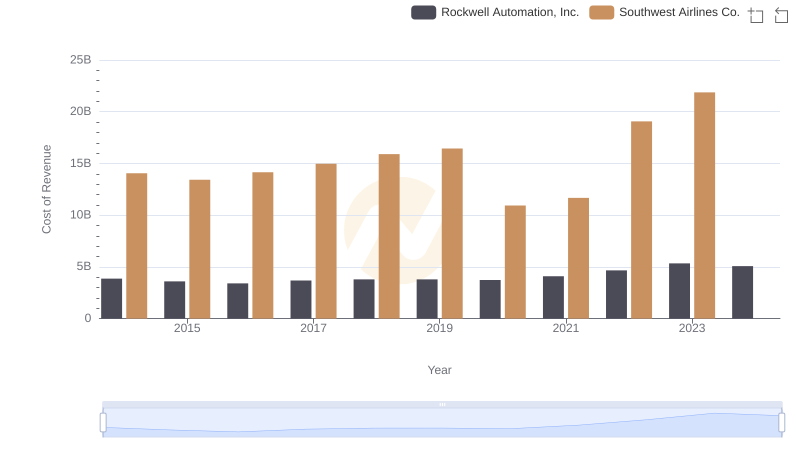
Cost Insights: Breaking Down Rockwell Automation, Inc. and Southwest Airlines Co.'s Expenses
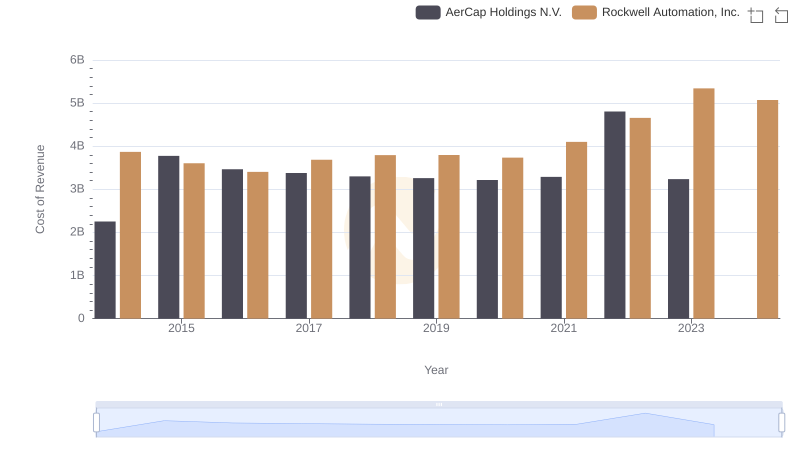
Analyzing Cost of Revenue: Rockwell Automation, Inc. and AerCap Holdings N.V.
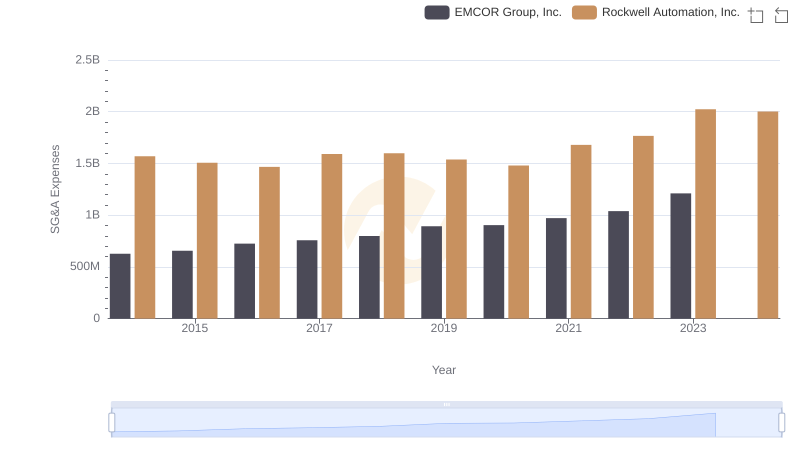
Comparing SG&A Expenses: Rockwell Automation, Inc. vs EMCOR Group, Inc. Trends and Insights
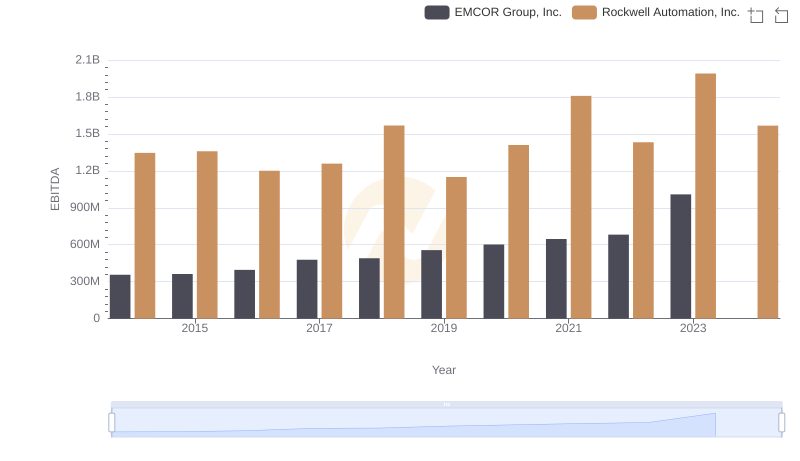
Rockwell Automation, Inc. and EMCOR Group, Inc.: A Detailed Examination of EBITDA Performance