| __timestamp | CNH Industrial N.V. | Rockwell Automation, Inc. |
|---|---|---|
| Wednesday, January 1, 2014 | 32555000000 | 6623500000 |
| Thursday, January 1, 2015 | 25912000000 | 6307900000 |
| Friday, January 1, 2016 | 24872000000 | 5879500000 |
| Sunday, January 1, 2017 | 27361000000 | 6311300000 |
| Monday, January 1, 2018 | 29706000000 | 6666000000 |
| Tuesday, January 1, 2019 | 28079000000 | 6694800000 |
| Wednesday, January 1, 2020 | 26032000000 | 6329800000 |
| Friday, January 1, 2021 | 33428000000 | 6997400000 |
| Saturday, January 1, 2022 | 23551000000 | 7760400000 |
| Sunday, January 1, 2023 | 24694000000 | 9058000000 |
| Monday, January 1, 2024 | 8264200000 |
Infusing magic into the data realm
In the competitive landscape of industrial automation and machinery, Rockwell Automation, Inc. and CNH Industrial N.V. have been key players. Over the past decade, Rockwell Automation has shown a steady revenue growth, peaking in 2023 with a 37% increase from its 2014 figures. Meanwhile, CNH Industrial experienced fluctuations, with its highest revenue in 2021, marking a 3% increase from 2014, but faced a decline in subsequent years.
Rockwell Automation's consistent upward trend highlights its resilience and strategic market positioning. In contrast, CNH Industrial's revenue volatility reflects the challenges in the global machinery market, including economic shifts and supply chain disruptions. As we look to the future, the missing data for 2024 leaves room for speculation on how these industry titans will navigate the evolving landscape.
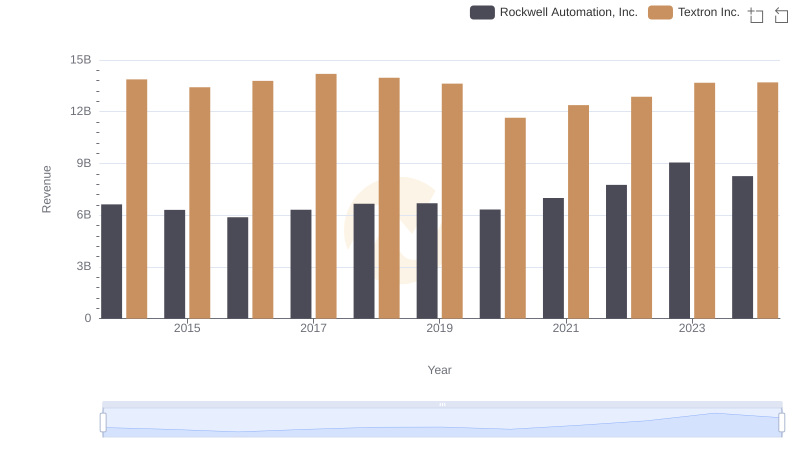
Who Generates More Revenue? Rockwell Automation, Inc. or Textron Inc.
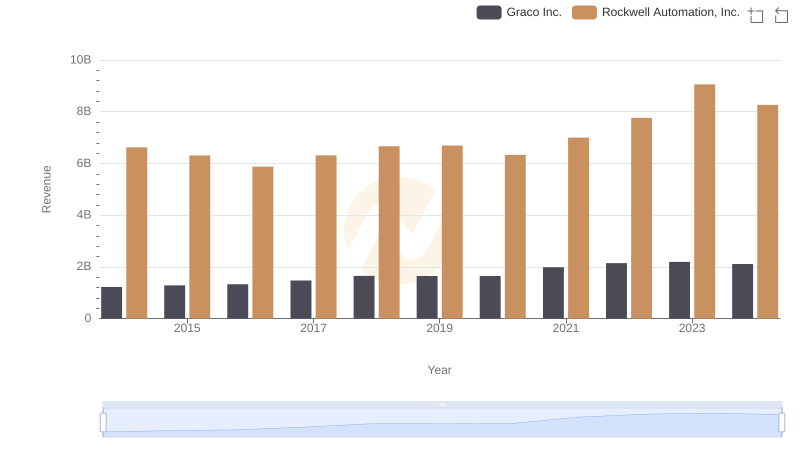
Rockwell Automation, Inc. vs Graco Inc.: Examining Key Revenue Metrics
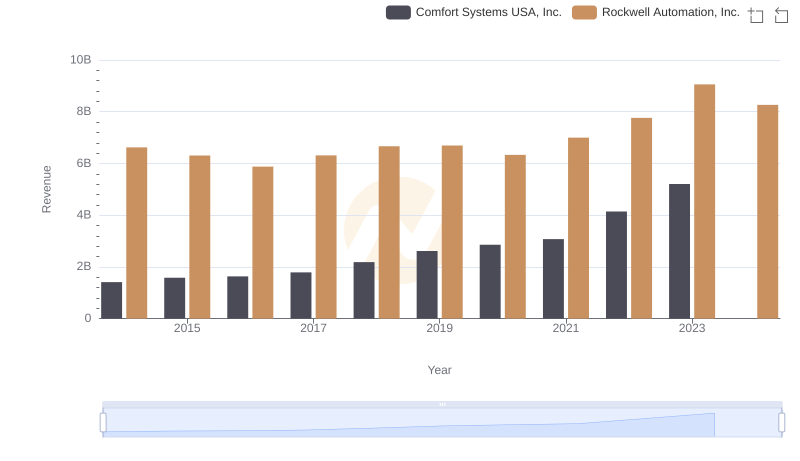
Comparing Revenue Performance: Rockwell Automation, Inc. or Comfort Systems USA, Inc.?
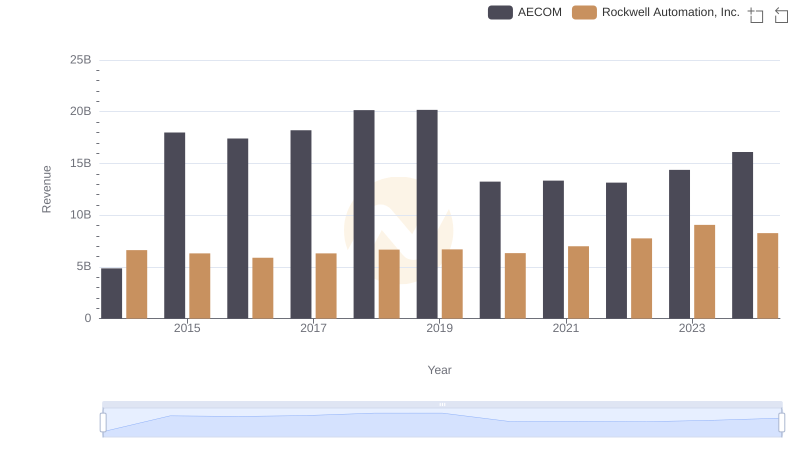
Breaking Down Revenue Trends: Rockwell Automation, Inc. vs AECOM

Revenue Showdown: Rockwell Automation, Inc. vs Saia, Inc.
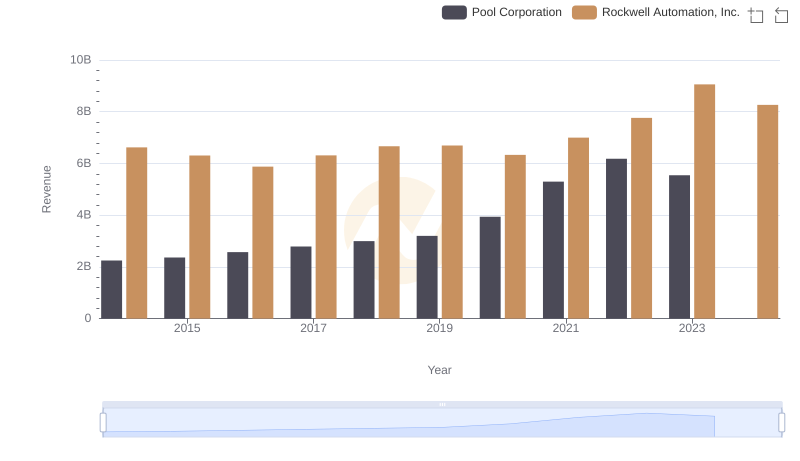
Annual Revenue Comparison: Rockwell Automation, Inc. vs Pool Corporation
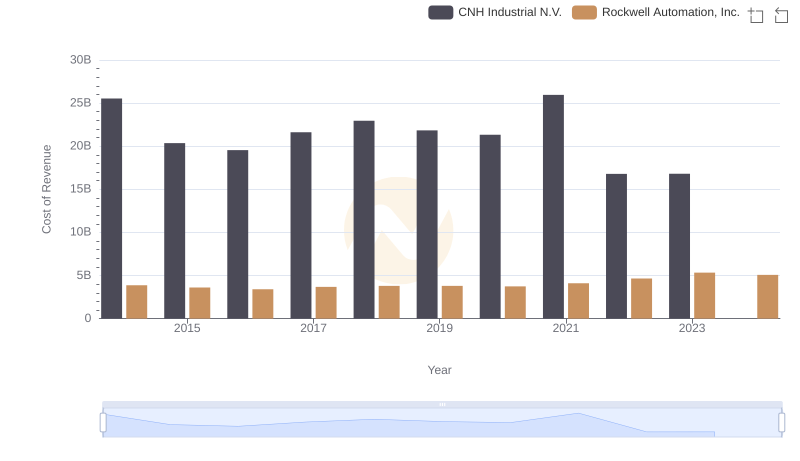
Comparing Cost of Revenue Efficiency: Rockwell Automation, Inc. vs CNH Industrial N.V.
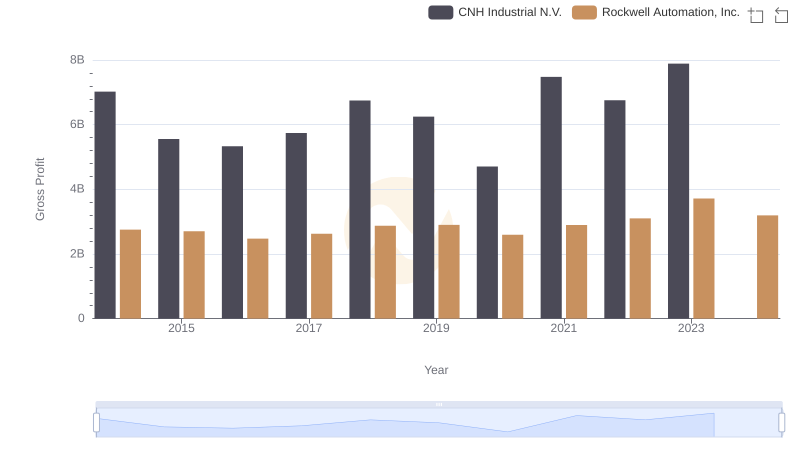
Rockwell Automation, Inc. and CNH Industrial N.V.: A Detailed Gross Profit Analysis
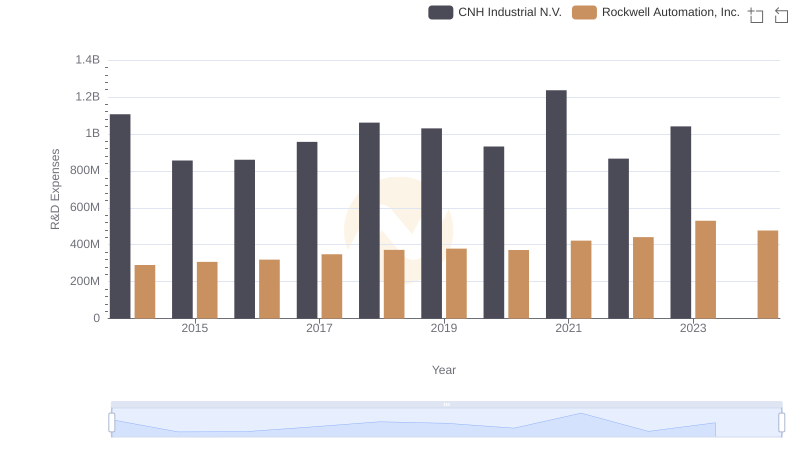
Research and Development Expenses Breakdown: Rockwell Automation, Inc. vs CNH Industrial N.V.
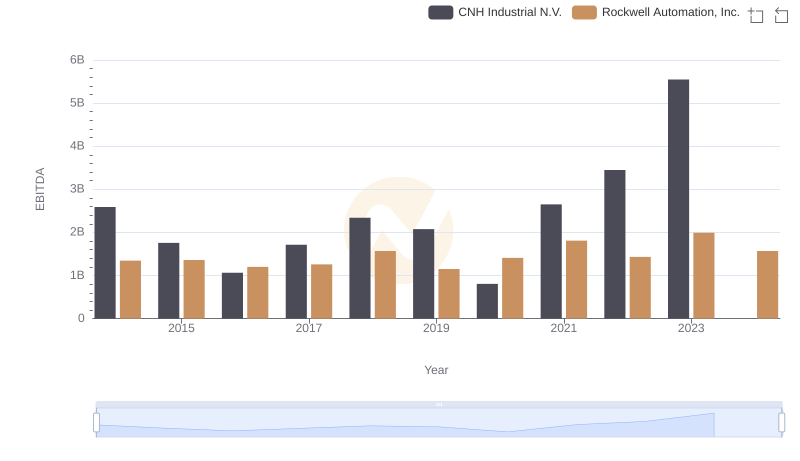
A Side-by-Side Analysis of EBITDA: Rockwell Automation, Inc. and CNH Industrial N.V.