| __timestamp | CNH Industrial N.V. | Rockwell Automation, Inc. |
|---|---|---|
| Wednesday, January 1, 2014 | 2591000000 | 1346000000 |
| Thursday, January 1, 2015 | 1757000000 | 1359100000 |
| Friday, January 1, 2016 | 1063000000 | 1200700000 |
| Sunday, January 1, 2017 | 1715000000 | 1258400000 |
| Monday, January 1, 2018 | 2339000000 | 1568400000 |
| Tuesday, January 1, 2019 | 2077000000 | 1150200000 |
| Wednesday, January 1, 2020 | 807000000 | 1410200000 |
| Friday, January 1, 2021 | 2650000000 | 1808300000 |
| Saturday, January 1, 2022 | 3447000000 | 1432100000 |
| Sunday, January 1, 2023 | 5549000000 | 1990700000 |
| Monday, January 1, 2024 | 1567500000 |
Unleashing insights
In the ever-evolving landscape of industrial automation and machinery, understanding financial health is crucial. This analysis delves into the EBITDA trends of Rockwell Automation, Inc. and CNH Industrial N.V. from 2014 to 2023. Over this decade, CNH Industrial showcased a remarkable growth trajectory, with its EBITDA surging by approximately 114%, peaking in 2023. In contrast, Rockwell Automation experienced a steadier climb, with a 48% increase over the same period. Notably, 2020 was a challenging year for CNH Industrial, with EBITDA dropping to its lowest, while Rockwell Automation maintained stability. The data for 2024 is incomplete, highlighting the need for continuous monitoring. This side-by-side analysis underscores the dynamic nature of the industry and the importance of strategic financial planning.

Revenue Showdown: Rockwell Automation, Inc. vs CNH Industrial N.V.
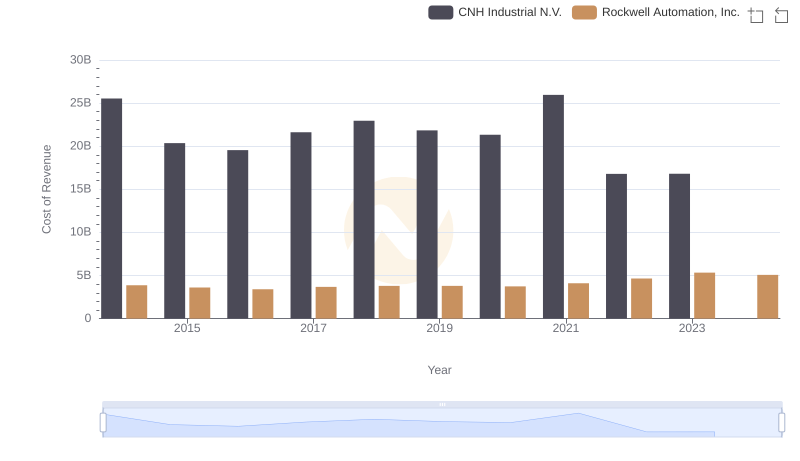
Comparing Cost of Revenue Efficiency: Rockwell Automation, Inc. vs CNH Industrial N.V.
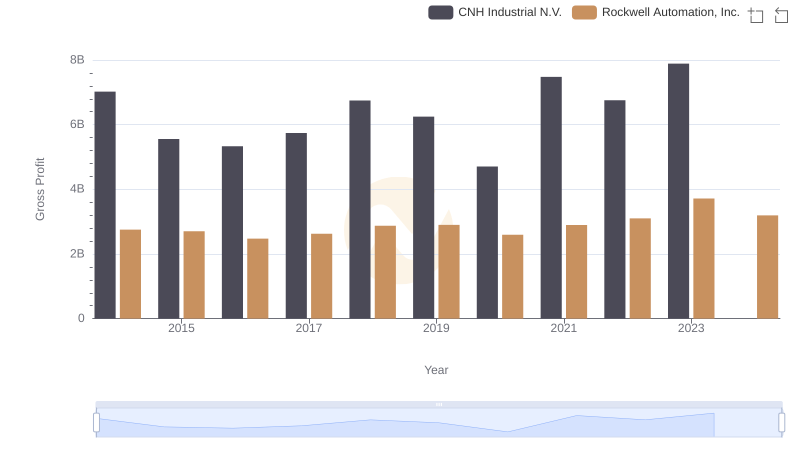
Rockwell Automation, Inc. and CNH Industrial N.V.: A Detailed Gross Profit Analysis
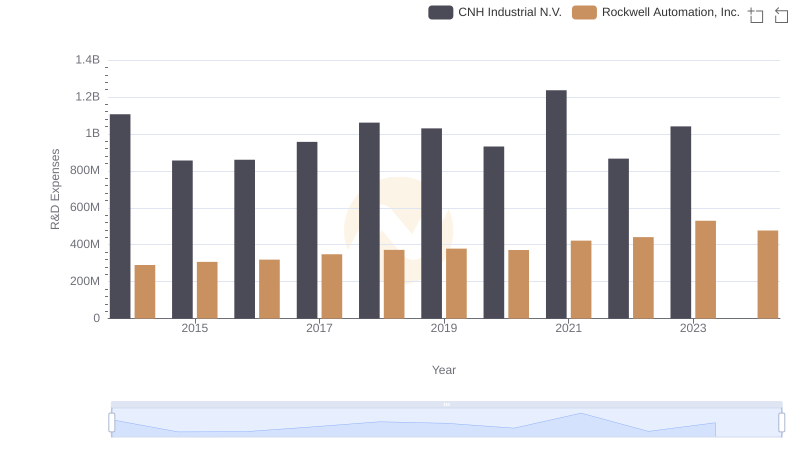
Research and Development Expenses Breakdown: Rockwell Automation, Inc. vs CNH Industrial N.V.

Comparative EBITDA Analysis: Rockwell Automation, Inc. vs AECOM
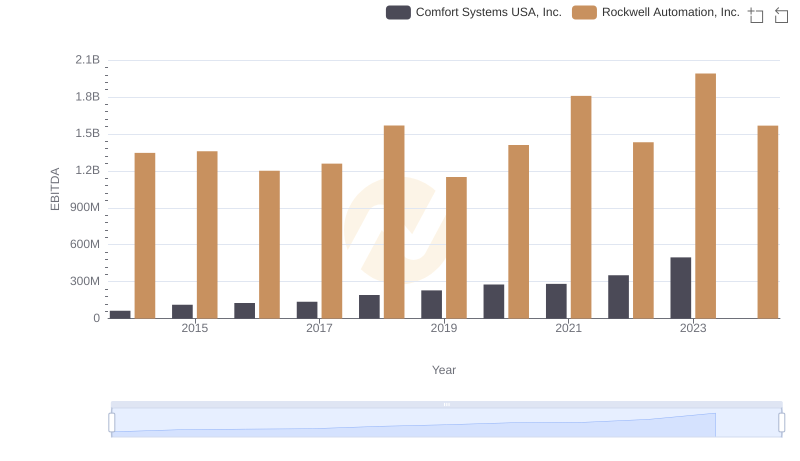
EBITDA Metrics Evaluated: Rockwell Automation, Inc. vs Comfort Systems USA, Inc.
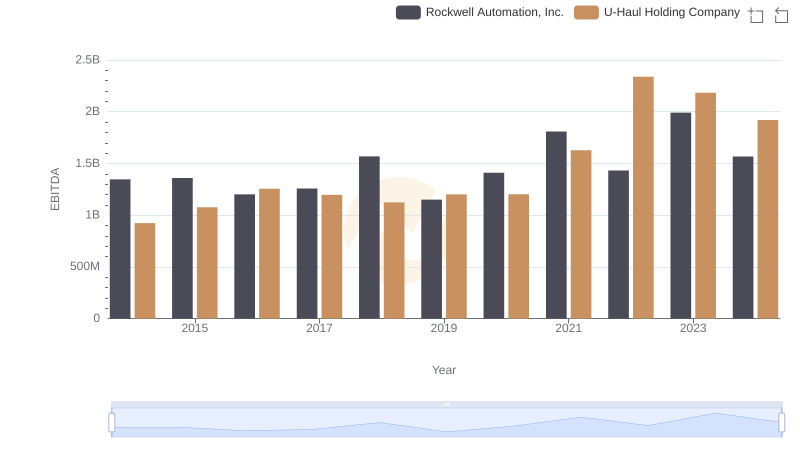
Rockwell Automation, Inc. and U-Haul Holding Company: A Detailed Examination of EBITDA Performance
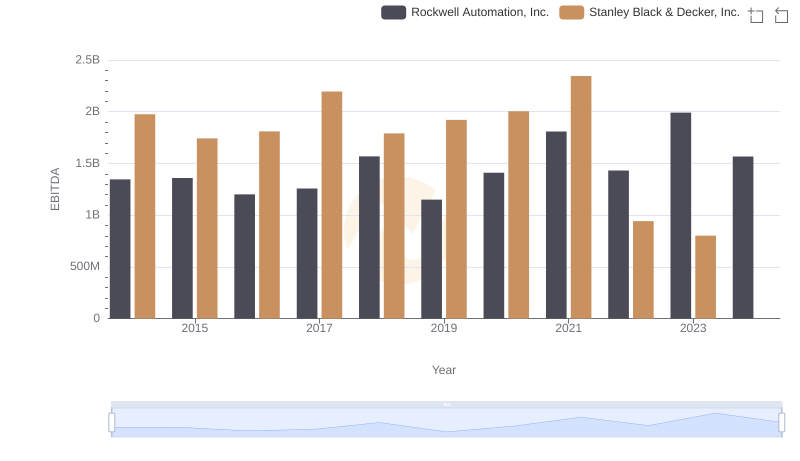
Comprehensive EBITDA Comparison: Rockwell Automation, Inc. vs Stanley Black & Decker, Inc.