| __timestamp | Avery Dennison Corporation | Lennox International Inc. |
|---|---|---|
| Wednesday, January 1, 2014 | 6330300000 | 3367400000 |
| Thursday, January 1, 2015 | 5966900000 | 3467400000 |
| Friday, January 1, 2016 | 6086500000 | 3641600000 |
| Sunday, January 1, 2017 | 6613800000 | 3839600000 |
| Monday, January 1, 2018 | 7159000000 | 3883900000 |
| Tuesday, January 1, 2019 | 7070100000 | 3807200000 |
| Wednesday, January 1, 2020 | 6971500000 | 3634100000 |
| Friday, January 1, 2021 | 8408300000 | 4194100000 |
| Saturday, January 1, 2022 | 9039300000 | 4718400000 |
| Sunday, January 1, 2023 | 8364299999 | 4981900000 |
| Monday, January 1, 2024 | 8755700000 | 5341300000 |
Infusing magic into the data realm
In the competitive landscape of industrial manufacturing, Lennox International Inc. and Avery Dennison Corporation have carved out significant niches. Over the past decade, Avery Dennison has consistently outperformed Lennox in terms of revenue, with a peak in 2022 reaching approximately 9 billion dollars. This represents a remarkable 43% increase from its 2015 low. Lennox, while trailing, has shown steady growth, culminating in a 58% rise from 2014 to 2023, reaching nearly 5 billion dollars.
The data reveals a fascinating narrative of resilience and growth, with Avery Dennison experiencing a slight dip in 2023, while Lennox continued its upward trajectory. This analysis underscores the dynamic nature of the industry and the strategic maneuvers these companies have employed to maintain their market positions. Missing data for 2024 suggests a need for further analysis to predict future trends.
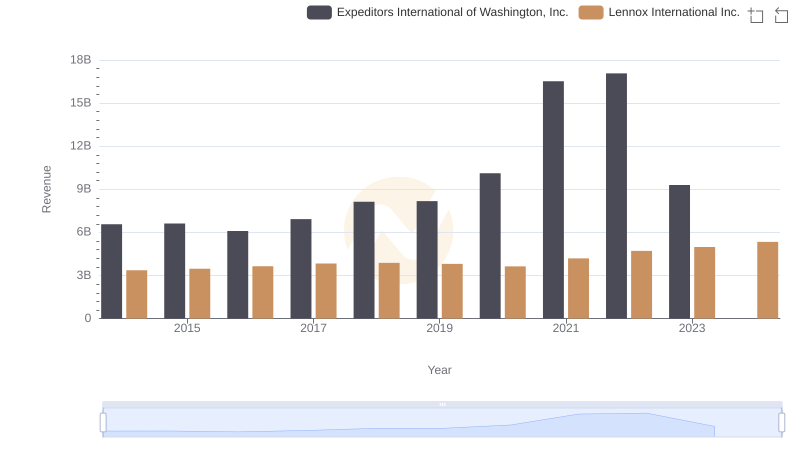
Lennox International Inc. vs Expeditors International of Washington, Inc.: Examining Key Revenue Metrics
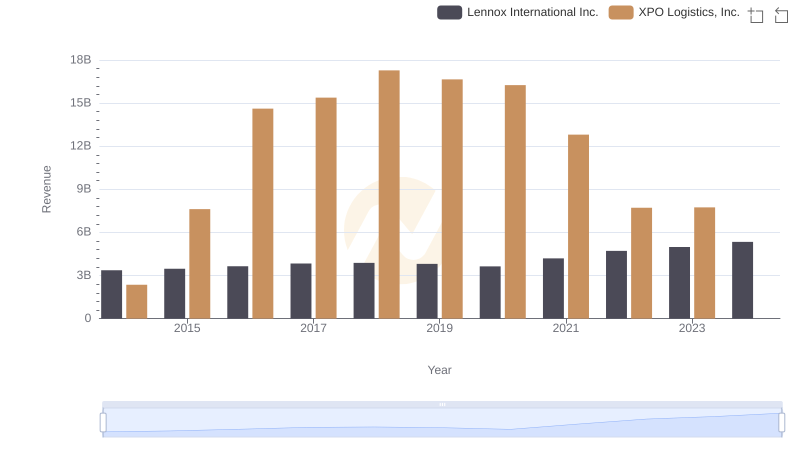
Revenue Showdown: Lennox International Inc. vs XPO Logistics, Inc.
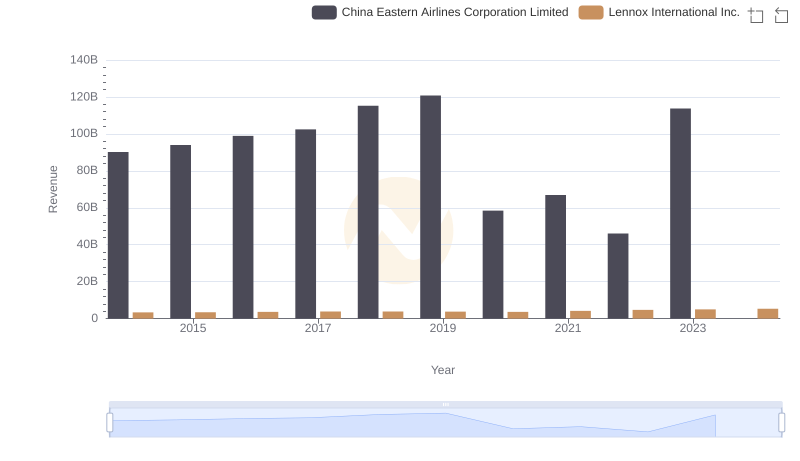
Revenue Insights: Lennox International Inc. and China Eastern Airlines Corporation Limited Performance Compared
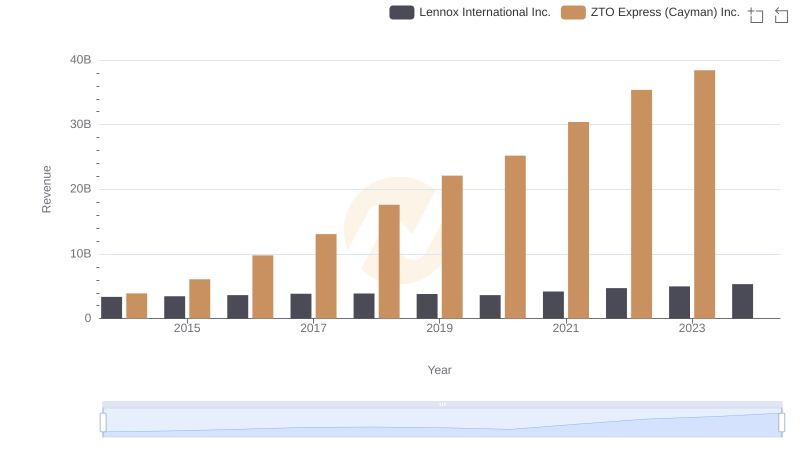
Lennox International Inc. and ZTO Express (Cayman) Inc.: A Comprehensive Revenue Analysis
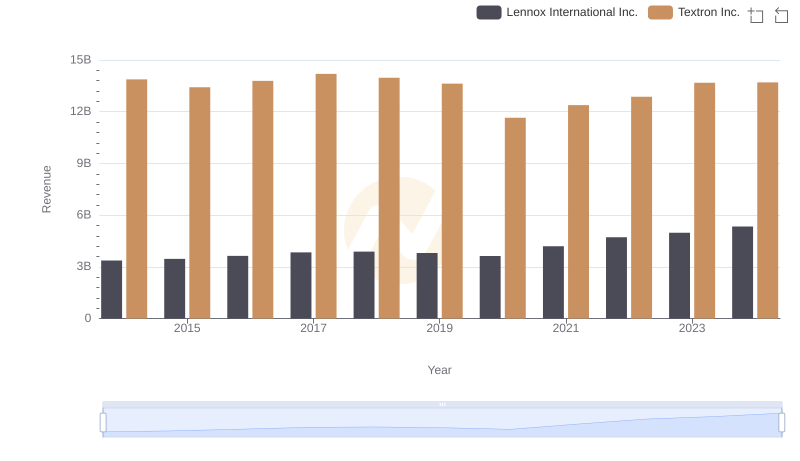
Lennox International Inc. vs Textron Inc.: Annual Revenue Growth Compared
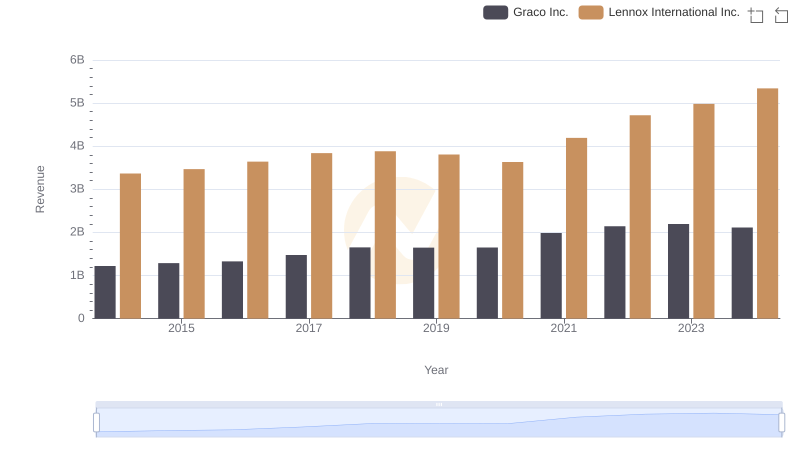
Revenue Showdown: Lennox International Inc. vs Graco Inc.
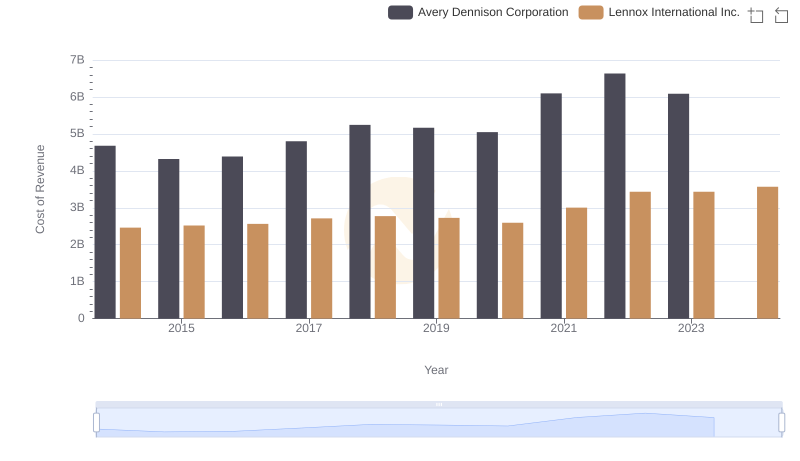
Cost of Revenue Comparison: Lennox International Inc. vs Avery Dennison Corporation
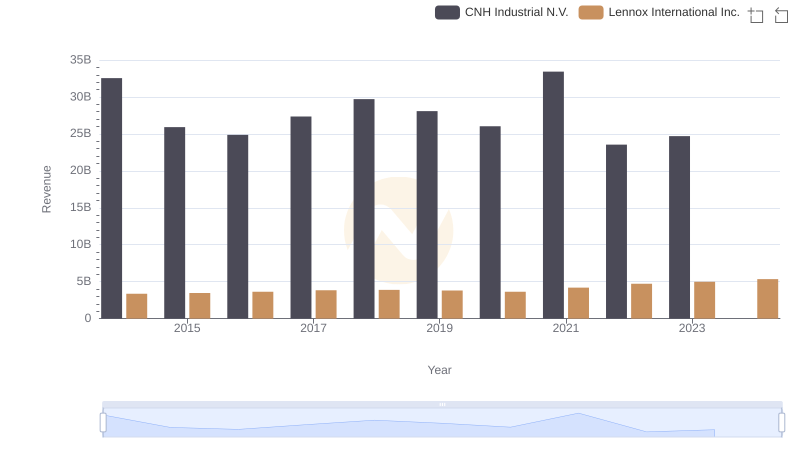
Lennox International Inc. and CNH Industrial N.V.: A Comprehensive Revenue Analysis
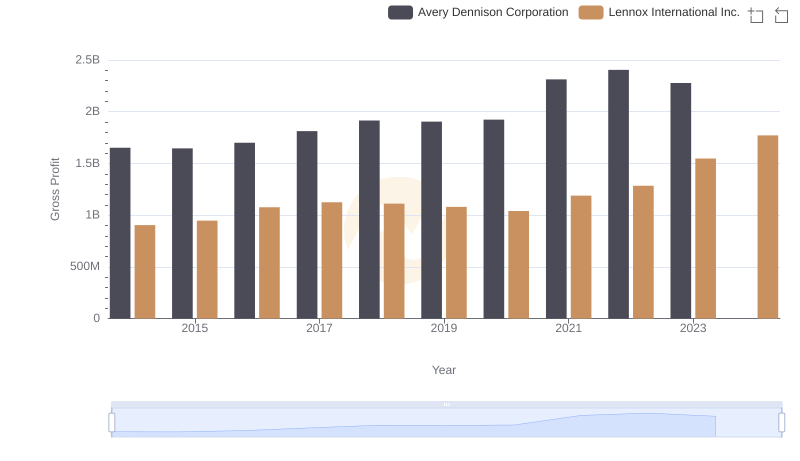
Gross Profit Analysis: Comparing Lennox International Inc. and Avery Dennison Corporation
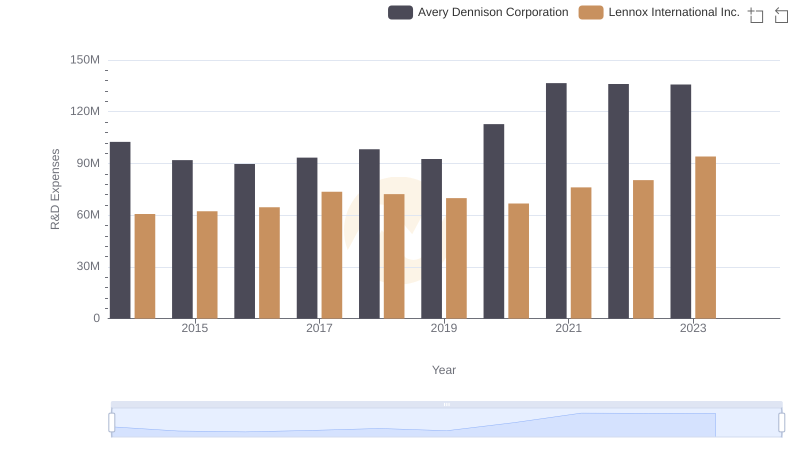
Lennox International Inc. or Avery Dennison Corporation: Who Invests More in Innovation?
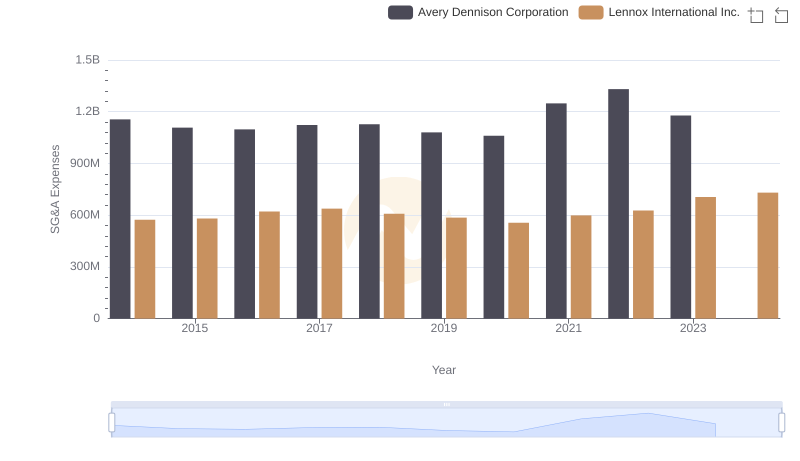
Operational Costs Compared: SG&A Analysis of Lennox International Inc. and Avery Dennison Corporation
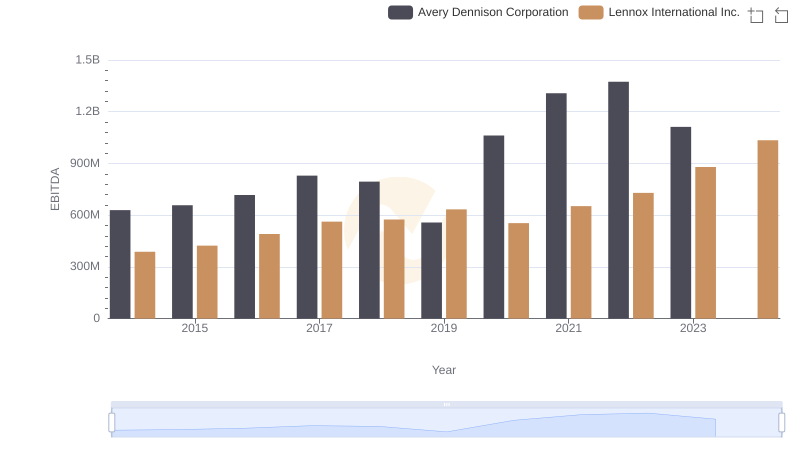
A Professional Review of EBITDA: Lennox International Inc. Compared to Avery Dennison Corporation