| __timestamp | Stanley Black & Decker, Inc. | Waste Connections, Inc. |
|---|---|---|
| Wednesday, January 1, 2014 | 4102700000 | 940778000 |
| Thursday, January 1, 2015 | 4072000000 | 939878000 |
| Friday, January 1, 2016 | 4267200000 | 1418151000 |
| Sunday, January 1, 2017 | 4778000000 | 1925713000 |
| Monday, January 1, 2018 | 4901900000 | 2057237000 |
| Tuesday, January 1, 2019 | 4805500000 | 2189922000 |
| Wednesday, January 1, 2020 | 4967900000 | 2169182000 |
| Friday, January 1, 2021 | 5194200000 | 2497287000 |
| Saturday, January 1, 2022 | 4284100000 | 2875847000 |
| Sunday, January 1, 2023 | 4098000000 | 3277438000 |
| Monday, January 1, 2024 | 4514400000 | 3727885000 |
Igniting the spark of knowledge
In the world of corporate finance, gross profit is a key indicator of a company's financial health. Over the past decade, Stanley Black & Decker, Inc. has consistently outperformed Waste Connections, Inc. in terms of gross profit. However, the gap has been narrowing. In 2014, Stanley Black & Decker's gross profit was more than four times that of Waste Connections. Fast forward to 2023, and Waste Connections has closed the gap significantly, achieving a gross profit that is approximately 80% of Stanley Black & Decker's.
This shift highlights Waste Connections' impressive growth trajectory, with a compound annual growth rate in gross profit of around 15% compared to Stanley Black & Decker's 1%. As Waste Connections continues to expand its market presence, the competition between these two industry leaders is set to intensify, offering intriguing insights for investors and analysts alike.
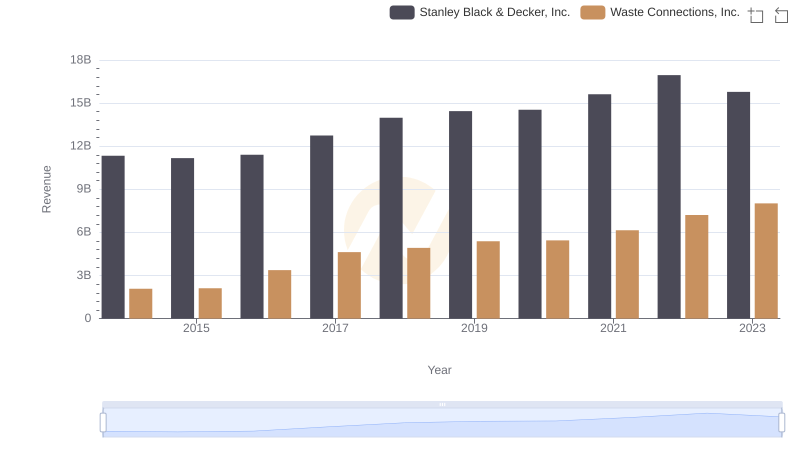
Comparing Revenue Performance: Waste Connections, Inc. or Stanley Black & Decker, Inc.?
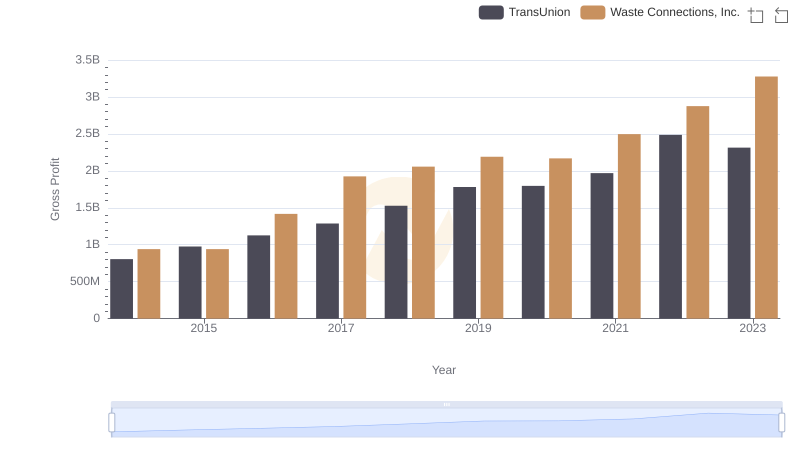
Who Generates Higher Gross Profit? Waste Connections, Inc. or TransUnion
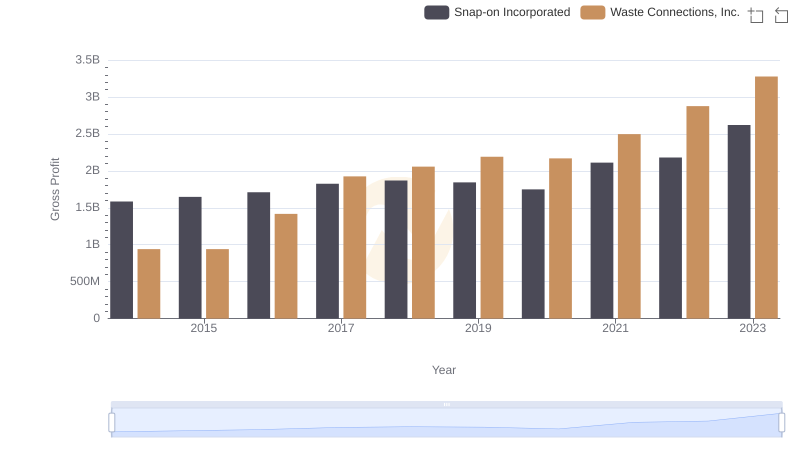
Waste Connections, Inc. vs Snap-on Incorporated: A Gross Profit Performance Breakdown
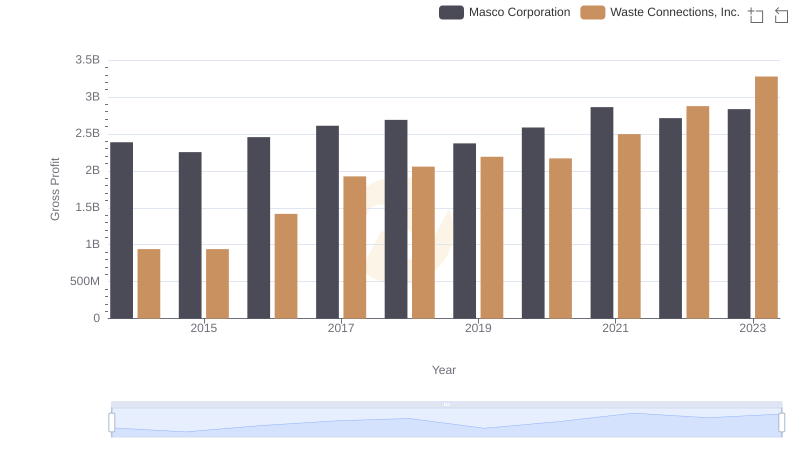
Gross Profit Trends Compared: Waste Connections, Inc. vs Masco Corporation
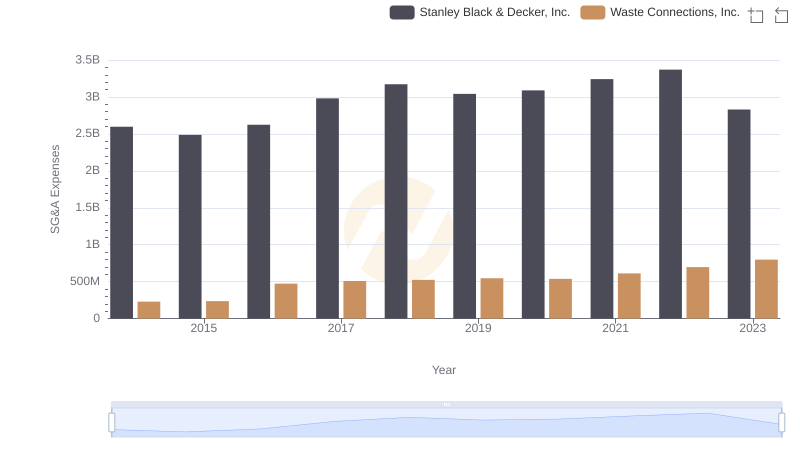
Breaking Down SG&A Expenses: Waste Connections, Inc. vs Stanley Black & Decker, Inc.
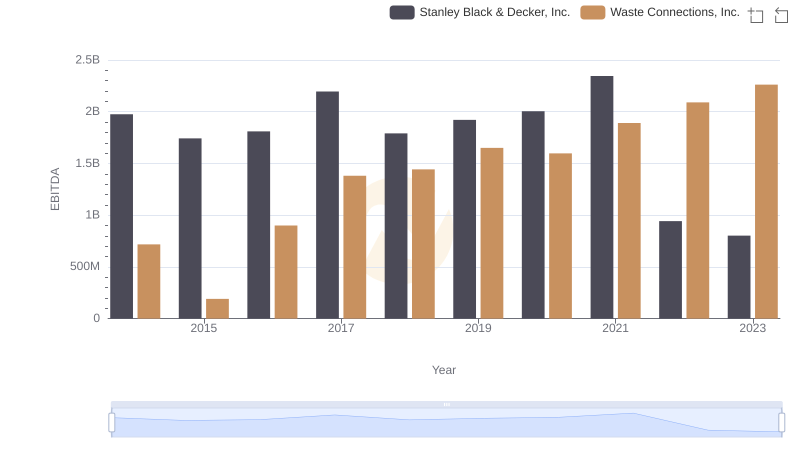
A Professional Review of EBITDA: Waste Connections, Inc. Compared to Stanley Black & Decker, Inc.
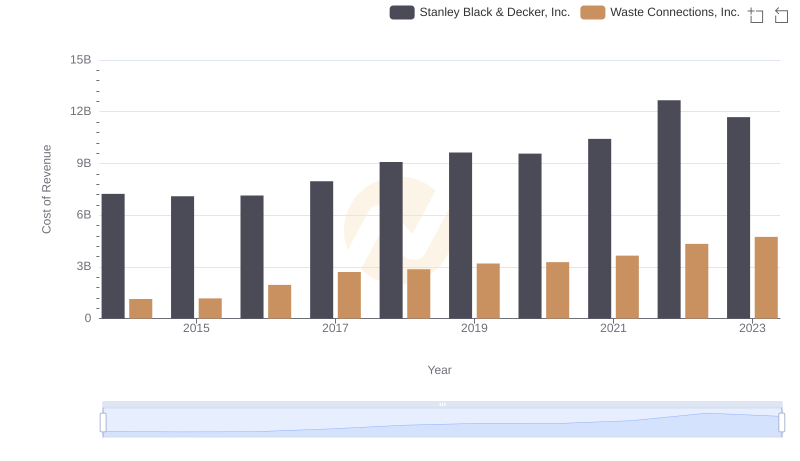
Cost Insights: Breaking Down Waste Connections, Inc. and Stanley Black & Decker, Inc.'s Expenses
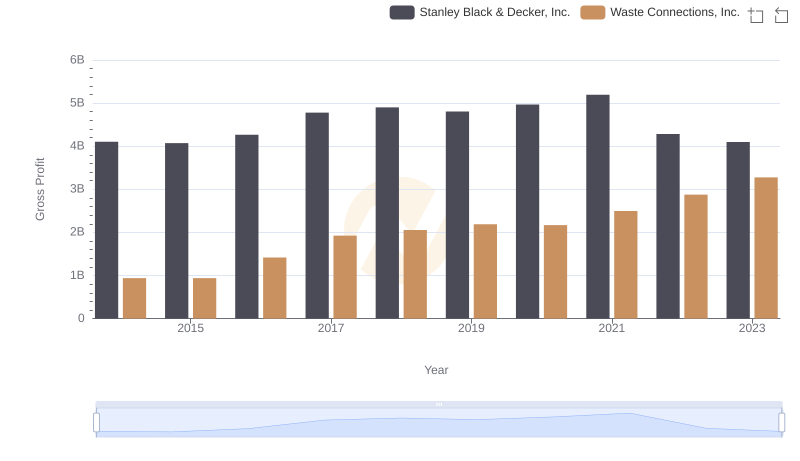
Gross Profit Analysis: Comparing Waste Connections, Inc. and Stanley Black & Decker, Inc.

Professional EBITDA Benchmarking: Waste Connections, Inc. vs Stanley Black & Decker, Inc.