| __timestamp | Stanley Black & Decker, Inc. | Waste Connections, Inc. |
|---|---|---|
| Wednesday, January 1, 2014 | 1975400000 | 717805000 |
| Thursday, January 1, 2015 | 1741900000 | 191002871 |
| Friday, January 1, 2016 | 1810200000 | 900371894 |
| Sunday, January 1, 2017 | 2196000000 | 1380632000 |
| Monday, January 1, 2018 | 1791200000 | 1442229014 |
| Tuesday, January 1, 2019 | 1920600000 | 1650754605 |
| Wednesday, January 1, 2020 | 2004200000 | 1597555000 |
| Friday, January 1, 2021 | 2345500000 | 1891001000 |
| Saturday, January 1, 2022 | 942800000 | 2090554149 |
| Sunday, January 1, 2023 | 802700000 | 2261354000 |
| Monday, January 1, 2024 | 286300000 | 2389779000 |
Cracking the code
In the ever-evolving landscape of corporate finance, EBITDA serves as a crucial metric for evaluating a company's operational performance. Over the past decade, Waste Connections, Inc. and Stanley Black & Decker, Inc. have showcased contrasting trajectories in their EBITDA growth. From 2014 to 2023, Waste Connections has experienced a remarkable surge, with its EBITDA increasing by over 215%, reaching approximately $2.26 billion in 2023. In contrast, Stanley Black & Decker's EBITDA has seen a decline of around 59% during the same period, dropping to about $802 million in 2023.
This divergence highlights Waste Connections' robust growth strategy and operational efficiency, while Stanley Black & Decker faces challenges in maintaining its financial momentum. As investors and analysts scrutinize these trends, the data underscores the importance of strategic adaptability in sustaining long-term financial health.
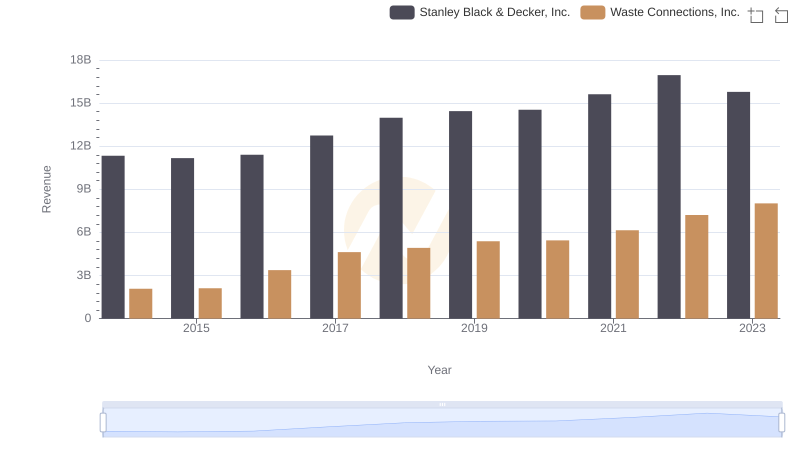
Comparing Revenue Performance: Waste Connections, Inc. or Stanley Black & Decker, Inc.?

Who Generates Higher Gross Profit? Waste Connections, Inc. or Stanley Black & Decker, Inc.
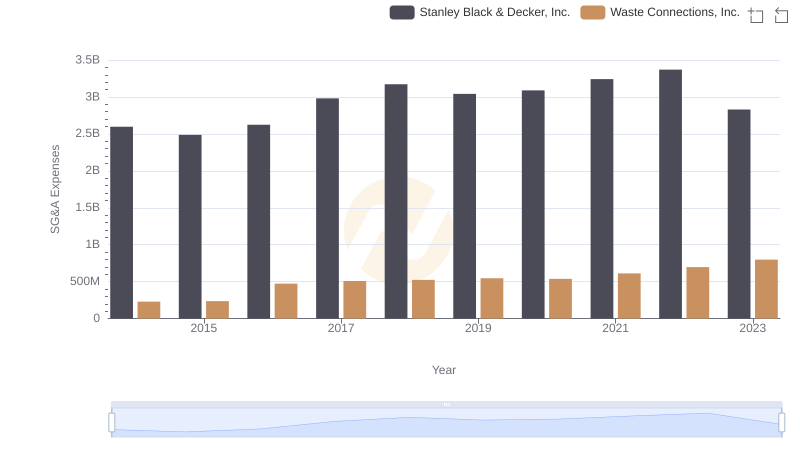
Breaking Down SG&A Expenses: Waste Connections, Inc. vs Stanley Black & Decker, Inc.
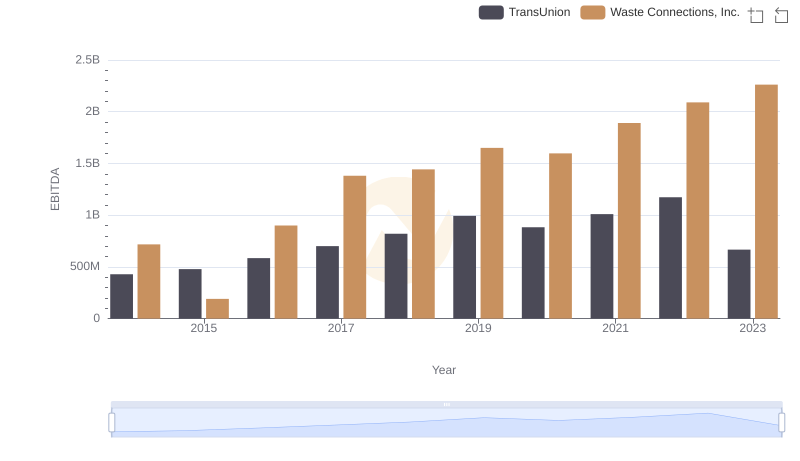
Waste Connections, Inc. vs TransUnion: In-Depth EBITDA Performance Comparison
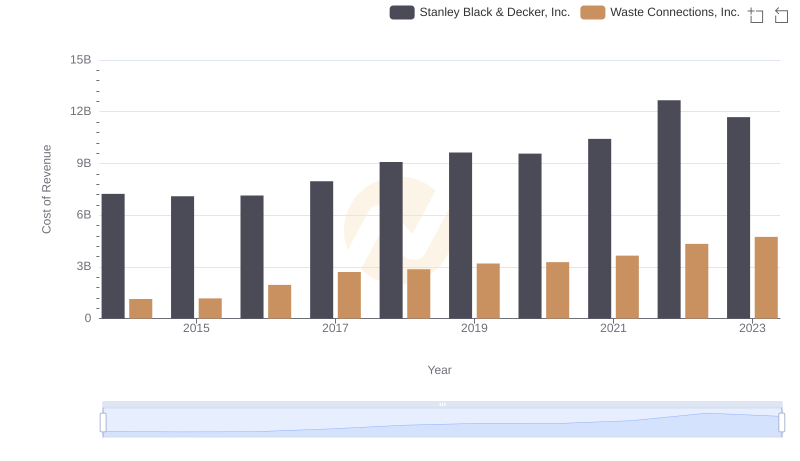
Cost Insights: Breaking Down Waste Connections, Inc. and Stanley Black & Decker, Inc.'s Expenses
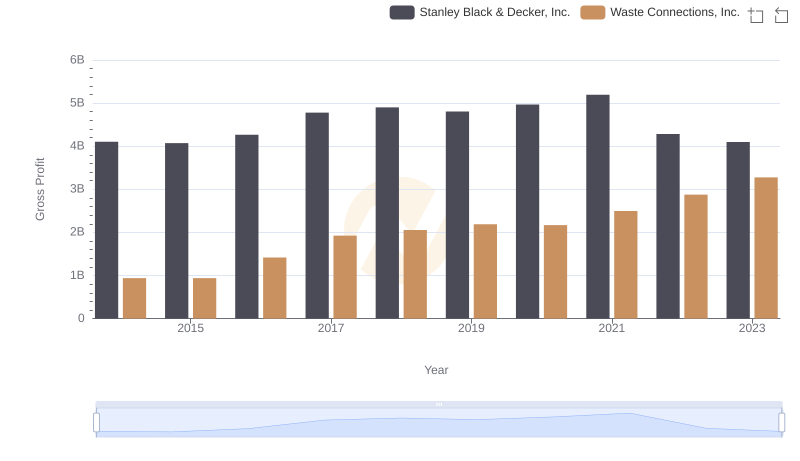
Gross Profit Analysis: Comparing Waste Connections, Inc. and Stanley Black & Decker, Inc.
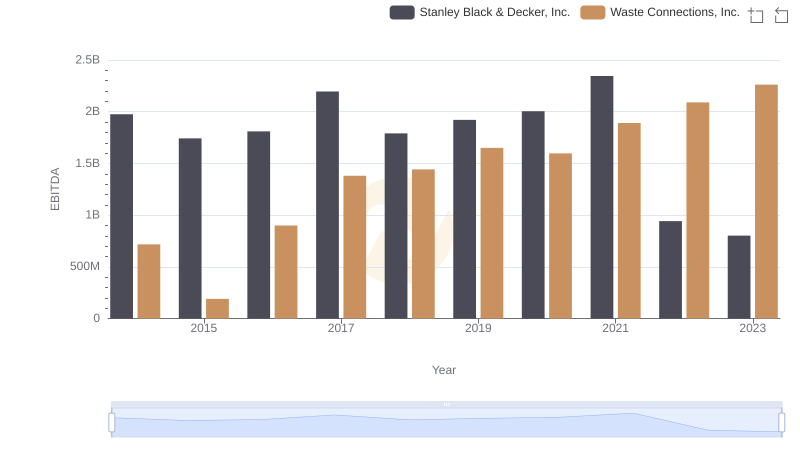
Professional EBITDA Benchmarking: Waste Connections, Inc. vs Stanley Black & Decker, Inc.