| __timestamp | Stanley Black & Decker, Inc. | Waste Connections, Inc. |
|---|---|---|
| Wednesday, January 1, 2014 | 11338600000 | 2079166000 |
| Thursday, January 1, 2015 | 11171800000 | 2117287000 |
| Friday, January 1, 2016 | 11406900000 | 3375863000 |
| Sunday, January 1, 2017 | 12747200000 | 4630488000 |
| Monday, January 1, 2018 | 13982400000 | 4922941000 |
| Tuesday, January 1, 2019 | 14442200000 | 5388679000 |
| Wednesday, January 1, 2020 | 14534600000 | 5445990000 |
| Friday, January 1, 2021 | 15617200000 | 6151361000 |
| Saturday, January 1, 2022 | 16947400000 | 7211859000 |
| Sunday, January 1, 2023 | 15781100000 | 8021951000 |
| Monday, January 1, 2024 | 15365700000 | 8919591000 |
Unlocking the unknown
In the ever-evolving landscape of corporate growth, Waste Connections, Inc. and Stanley Black & Decker, Inc. have showcased remarkable revenue trajectories over the past decade. From 2014 to 2023, Stanley Black & Decker's revenue surged by approximately 39%, peaking in 2022. Meanwhile, Waste Connections demonstrated an even more impressive growth, with revenue nearly quadrupling, reflecting a robust expansion strategy.
This comparative analysis not only highlights the dynamic nature of these industries but also offers a glimpse into the strategic maneuvers that have propelled these companies forward.
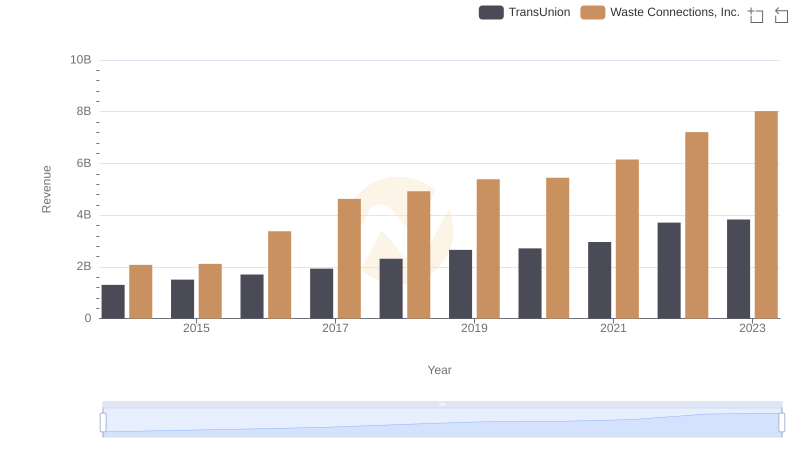
Comparing Revenue Performance: Waste Connections, Inc. or TransUnion?
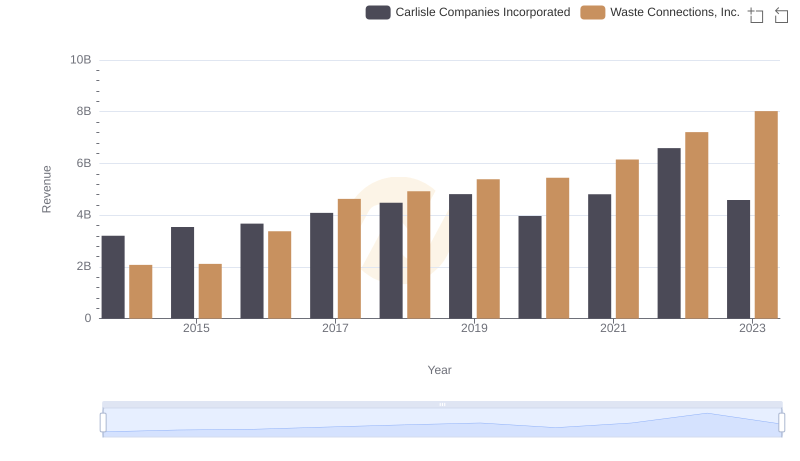
Revenue Showdown: Waste Connections, Inc. vs Carlisle Companies Incorporated

Who Generates Higher Gross Profit? Waste Connections, Inc. or Stanley Black & Decker, Inc.
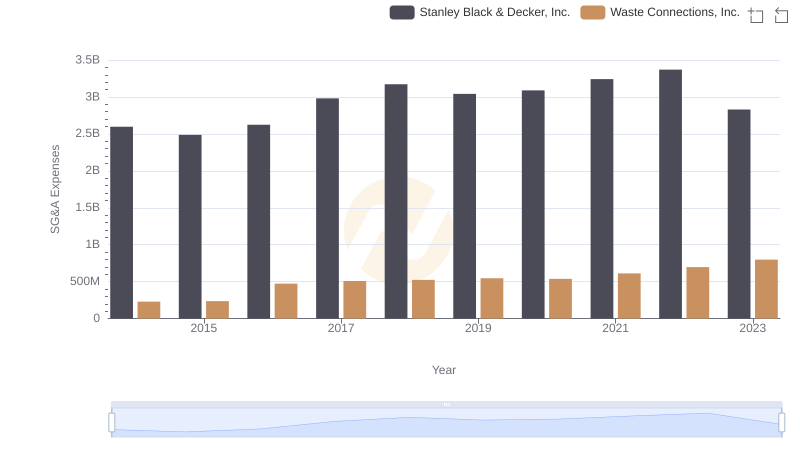
Breaking Down SG&A Expenses: Waste Connections, Inc. vs Stanley Black & Decker, Inc.
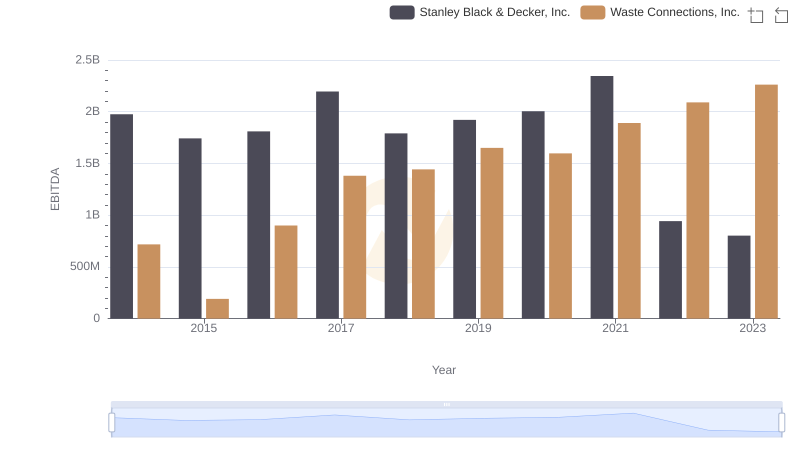
A Professional Review of EBITDA: Waste Connections, Inc. Compared to Stanley Black & Decker, Inc.
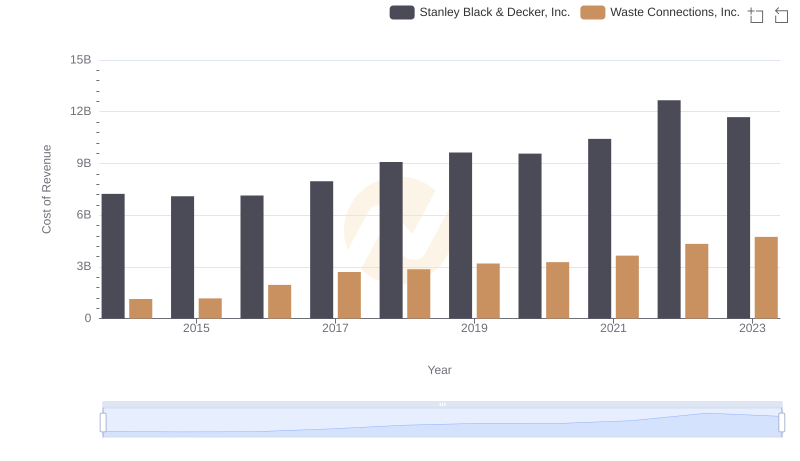
Cost Insights: Breaking Down Waste Connections, Inc. and Stanley Black & Decker, Inc.'s Expenses
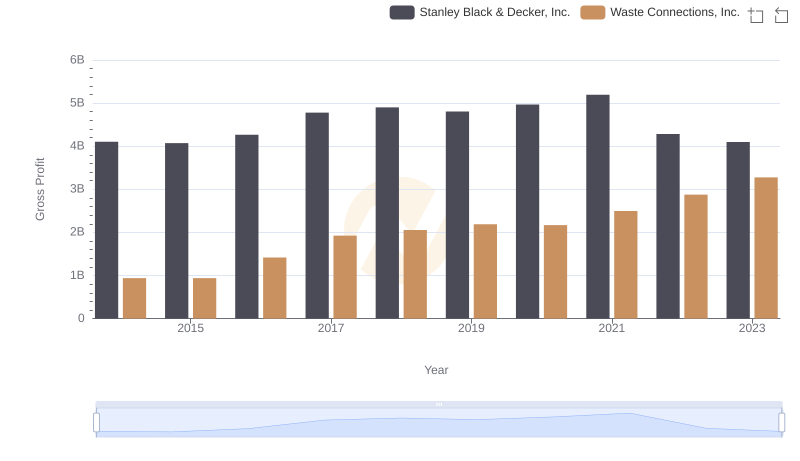
Gross Profit Analysis: Comparing Waste Connections, Inc. and Stanley Black & Decker, Inc.

Professional EBITDA Benchmarking: Waste Connections, Inc. vs Stanley Black & Decker, Inc.