| __timestamp | Stanley Black & Decker, Inc. | Waste Connections, Inc. |
|---|---|---|
| Wednesday, January 1, 2014 | 2595900000 | 229474000 |
| Thursday, January 1, 2015 | 2486400000 | 237484000 |
| Friday, January 1, 2016 | 2623900000 | 474263000 |
| Sunday, January 1, 2017 | 2980100000 | 509638000 |
| Monday, January 1, 2018 | 3171700000 | 524388000 |
| Tuesday, January 1, 2019 | 3041000000 | 546278000 |
| Wednesday, January 1, 2020 | 3089600000 | 537632000 |
| Friday, January 1, 2021 | 3240400000 | 612337000 |
| Saturday, January 1, 2022 | 3370000000 | 696467000 |
| Sunday, January 1, 2023 | 2829300000 | 799119000 |
| Monday, January 1, 2024 | 3310500000 | 883445000 |
Unveiling the hidden dimensions of data
In the ever-evolving landscape of corporate finance, understanding the nuances of Selling, General, and Administrative (SG&A) expenses is crucial. Over the past decade, Stanley Black & Decker, Inc. has consistently reported higher SG&A expenses compared to Waste Connections, Inc. In 2022, Stanley Black & Decker's SG&A expenses peaked at approximately 3.37 billion, marking a 30% increase from 2014. Conversely, Waste Connections saw a more dramatic rise, with expenses growing by nearly 250% from 2014 to 2023, reaching around 799 million.
This divergence highlights the distinct operational strategies of these companies. While Stanley Black & Decker's expenses reflect its expansive global operations, Waste Connections' growth in SG&A expenses underscores its aggressive expansion in the waste management sector. As we move forward, these trends offer valuable insights into the financial health and strategic priorities of these industry giants.
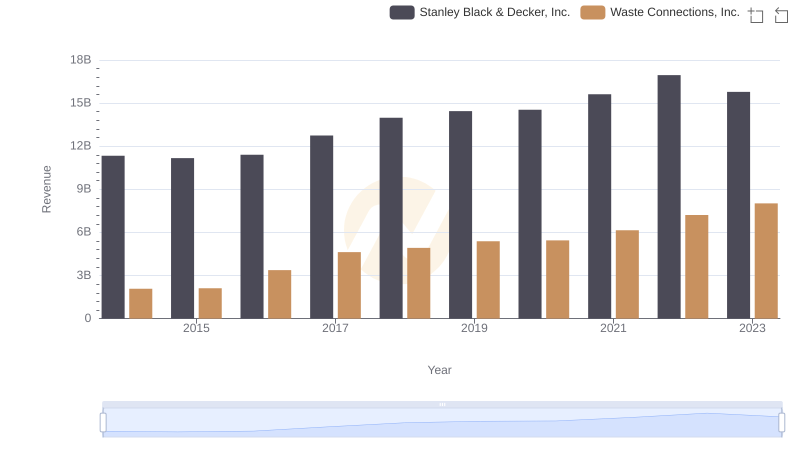
Comparing Revenue Performance: Waste Connections, Inc. or Stanley Black & Decker, Inc.?

Who Generates Higher Gross Profit? Waste Connections, Inc. or Stanley Black & Decker, Inc.
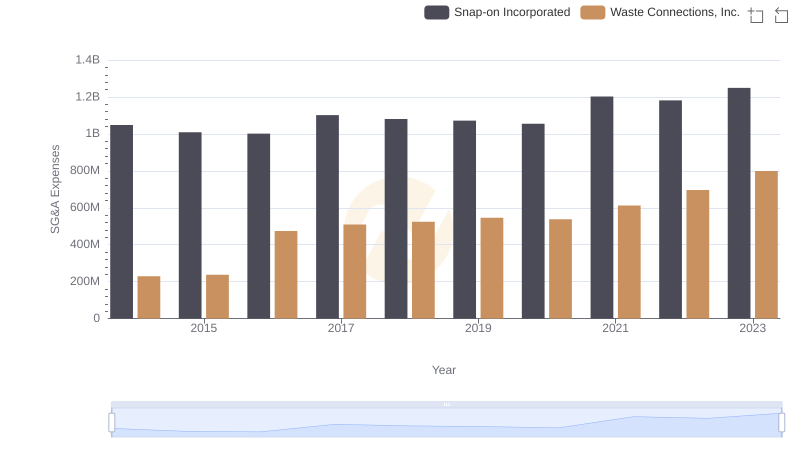
Operational Costs Compared: SG&A Analysis of Waste Connections, Inc. and Snap-on Incorporated
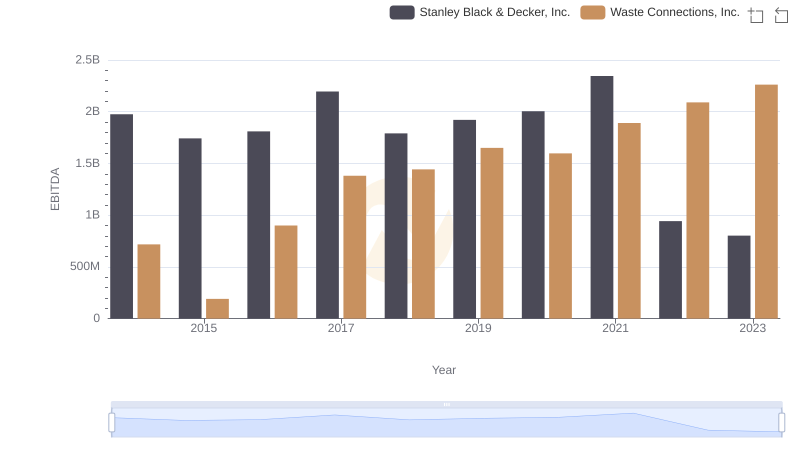
A Professional Review of EBITDA: Waste Connections, Inc. Compared to Stanley Black & Decker, Inc.
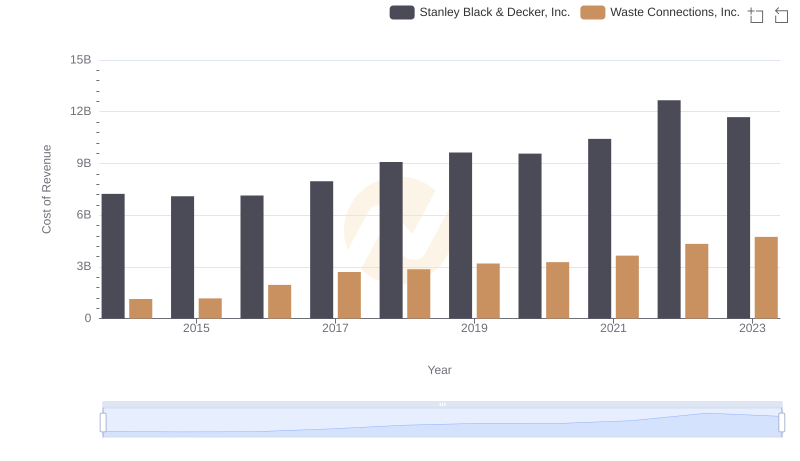
Cost Insights: Breaking Down Waste Connections, Inc. and Stanley Black & Decker, Inc.'s Expenses
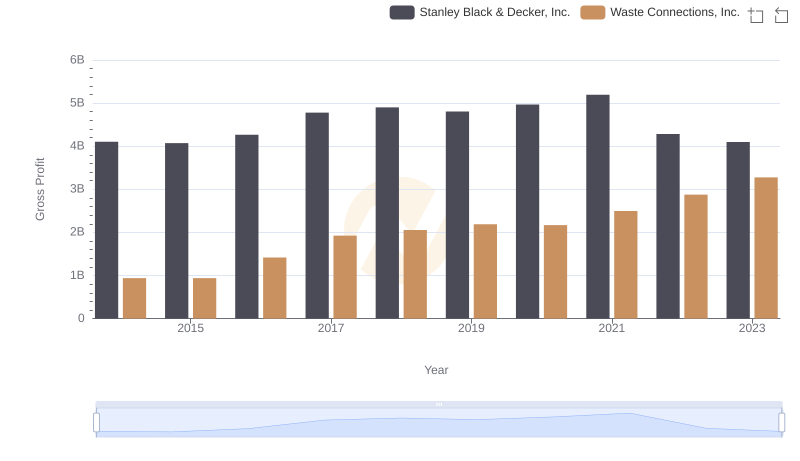
Gross Profit Analysis: Comparing Waste Connections, Inc. and Stanley Black & Decker, Inc.

Professional EBITDA Benchmarking: Waste Connections, Inc. vs Stanley Black & Decker, Inc.